Note: This publication is currently undergoing major revisions. The current publication will be replaced with a new publication based on stakeholder requirements and scientific advances. We expect to begin sharing details on this soon. If you have input on content, format, or publication frequency at any time, please contact us at cbrfc.webmasters@noaa.gov.Great Basin Water Supply Outlook, April 1, 2009Great Basin Water Supply Outlook, April 1, 2009
Contents
Great Basin Summary
Snow Water Equivalent & Precipitation -
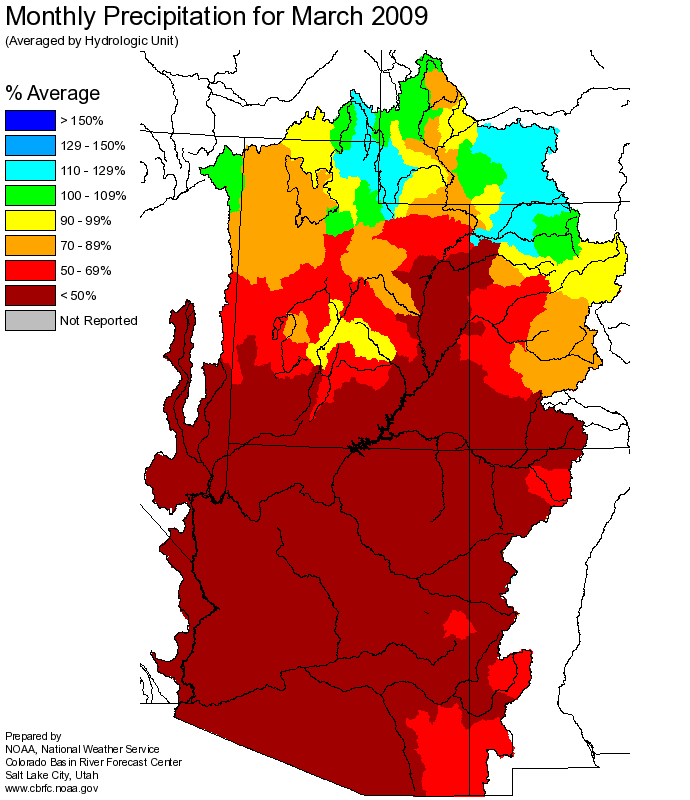
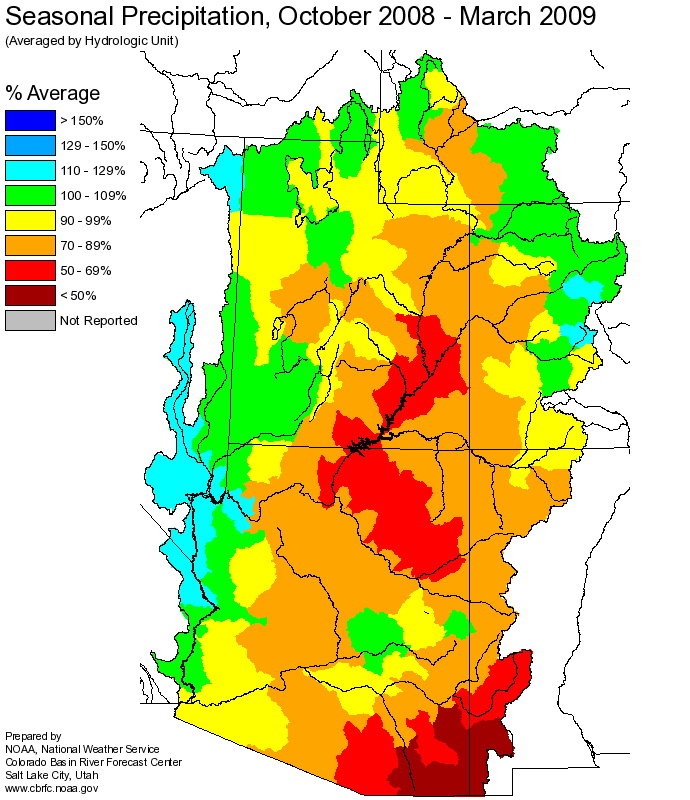
March monthly precipitation in the Great Basin was 106% of average. After a very warm 2 weeks during mid March
that brought on early melt, a series of wet storms brought snow totals back to 100% of average.
Indexed snow totals are now 100% of average in the Weber and Ogden basins, 99% in the Provo
basin, 95% in the Bear River basin and 108% in the Six Creeks basin. Seasonal precipitation for the Great Basin
Salt Lake Basin is now 104% of average and overall indexed snow water equivalents are 97% of average for all 4 basins.
Soil Moisture & Streamflow - Modeled
soil
moisture heading into the winter was much below average in all headwater regions, which tends to lower April through July volume forecasts.
However, some early runoff has streamflow for selected points in each of the four main drainages 103% of average.
Short Term Precipitation Forecasts -
Weather guidance from
National Weather Service Meteorological Models show cool and wet conditions during the first 6-10 days of April.
Short term
CPC guidance shows no signal for the second half of April.
General Discussion -
Longer range predictions from NOAA's Climate Prediction Center are now factoring in a weak
La Nina
episode, predicted to last through the spring of 2009. Please reference the web link above
for further details and effects within the Great Basin.
Volumetric forecasts were raised due to increases in snow water equivalents on the Weber, Provo and Bear and held mostly steady for Utah Lake and it's associated drainages.
Last month we began forecasting the max summer elevation of the Great Basin.
Current ESP estimates are for a final maximum elevation of 4194.66 ft.above mean sea level by early to mid May, 2009. The lake is currently
at 4194.13 ft. above mean sea level
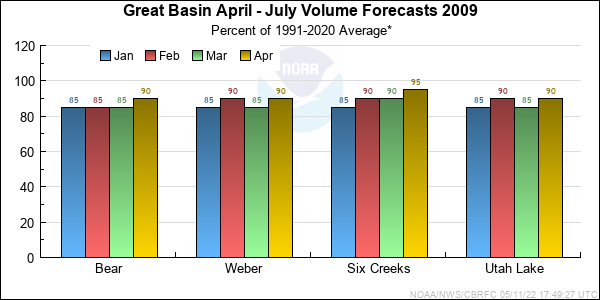
*Median of forecasts within each basin.
Bear Basin Conditions
Snow Water Equivalent & Precipitation -
Snow Water Equivalent and precipitation conditions in the Bear River drainage improved during March. Monthly
precipitation was 115% of average and
snow
water equivalent increased to 95% of average. Seasonal precipitation is currently 104% of average.
Soil Moisture & Streamflow -
Observed streamflows for March were estimated for Bear at the UT/WY State line at 45% of average. Observed flows on the Logan River nr Logan above
State Dam were 84% of average.
Short Term Precipitation Forecasts -
Short term National Weather Service Models are indicating a period of cool and wet weather during the first 6-10 days of April.
Short term
CPC guidance shows no signal for the second half of April.
General Discussion -
Volumetric forecast for April through July range from 53% at Bear River nr Montpelier to 93% of average at the Bear River, Utah, Wyoming State line.
* Percent usable capacity, not percent average contents.
Click for multi-month Graph.
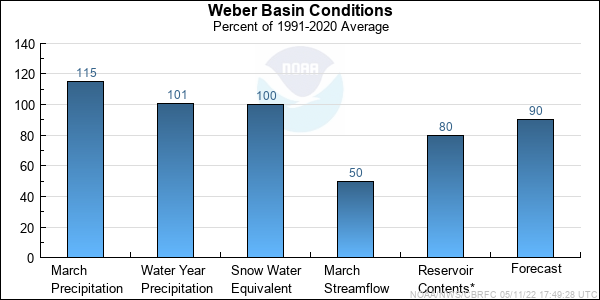
Weber Basin Conditions
Snow Water Equivalent and Precipitation -
Conditions in the Weber and Ogden River River basins improved after a warm and dry period in mid March. Monthly
precipiation totalled 114% of average, while
snow
water equivalent numbers improved to 100% of average. Seasonal precipitation increased slightly to 101% of average.
Soil Moisture & Streamflow -
Soil moisture conditions were dry in the upper basin prior to winter snow accumulation, varying from 70% to 89% of average. Observed streamflows this month for
Weber at Oakley were 50% of average and Chalk Creek at Coalville were 70% of average.
Short Term Precipitation Forecasts -
Short term weather service models are indicating a period cool and wet weather during the first 6-10 days of April.
Short term CPC guidance shows no signal for the second half of April.
General Discussion -
Volumetric forecasts now range from 85% at Weber River at Echo Reservoir to 102% of average at Wheeler Creek near Pineview Reservoir.
* Percent usable capacity, not percent average contents.
Click for multi-month Graph.
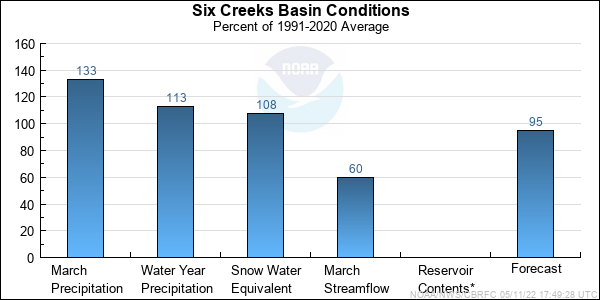
Six Creeks Basin Conditions
Snow Water Equivalent & Precipitation -
Snow Water Equivalent and precipitation conditions in the Six Creeks basins improved during March. Monthly precipitation was 133% of average and
snow water equivalent
is 108% of average. Seasonal precipitation now totals 113% of average.
Soil Moisture & Streamflow -
Streamflows in Mill Creek 60% of average. Soil moisture in the fall ranged from 50%-90% of average.
Short Term Precipitation Forecasts -
Short term weather service models are indicating a period of cool and wet weather during the next 6-10 days of April.
Short term
CPC guidance shows no signal for the second half of April.
General Discussion -
Volumetric forecasts were raised slightly this month. Forecast now range from 93% at Emigration Creek near Salt Lake City to 105% at City Creek near Salt Lake City.
* Percent usable capacity, not percent average contents.
Click for multi-month Graph.
Utah Lake Basin Conditions
Snow Water Equivalent & Precipitation -
Snow Water Equivalent and precipitation conditions in the Utah Lake drainages improved slightly during the later half of March . Monthly precipitation
totalled 96% and
snow
water equivalent numbers are 99% of average. Seasonal precipitation now totals 101% of average.
Soil Moisture & Streamflow -
Streamflows for the Provo River at Woodland were 85% of average. Soil moisture in the fall along the Provo River range from 50-90% of
average. The Spanish Fork drainage fall soil moisture ranges from 70% to 99% of average.
Short Term Precipitation Forecasts -
Short term weather service models are indicating a period of cool and wet weather during the first 6-10 days of April.
Short term
CPC guidance shows no signal for the second half of April.
General Discussion -
Volumetric forecast for Utah Lake drainages were mostly unchanged this month. The forecast now range from 86% at Utah Lake to 91% at Spanish Fork River Nr Castilla.
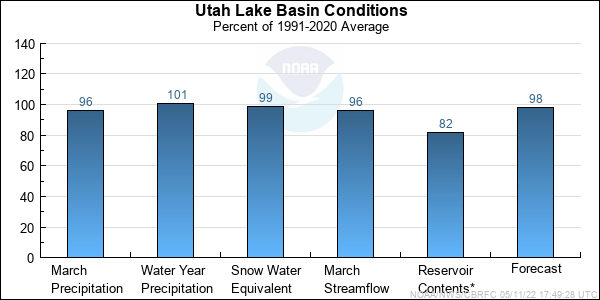
* Percent usable capacity, not percent average contents.
Click for multi-month Graph.
Differences between the full period forecasts and the residual forecasts may not exactly equal the actual observed volumes due to rounding conventions (see Definitions section).
Precipitation Maps
Hydrologist: B.Bernard
