Note: This publication is currently undergoing major revisions. The current publication will be replaced with a new publication based on stakeholder requirements and scientific advances. We expect to begin sharing details on this soon. If you have input on content, format, or publication frequency at any time, please contact us at cbrfc.webmasters@noaa.gov.Great Basin Water Supply Outlook, May 1, 2009Great Basin Water Supply Outlook, May 1, 2009
Contents
Great Basin Summary
-Snow Water Equivalent & Precipitation ...
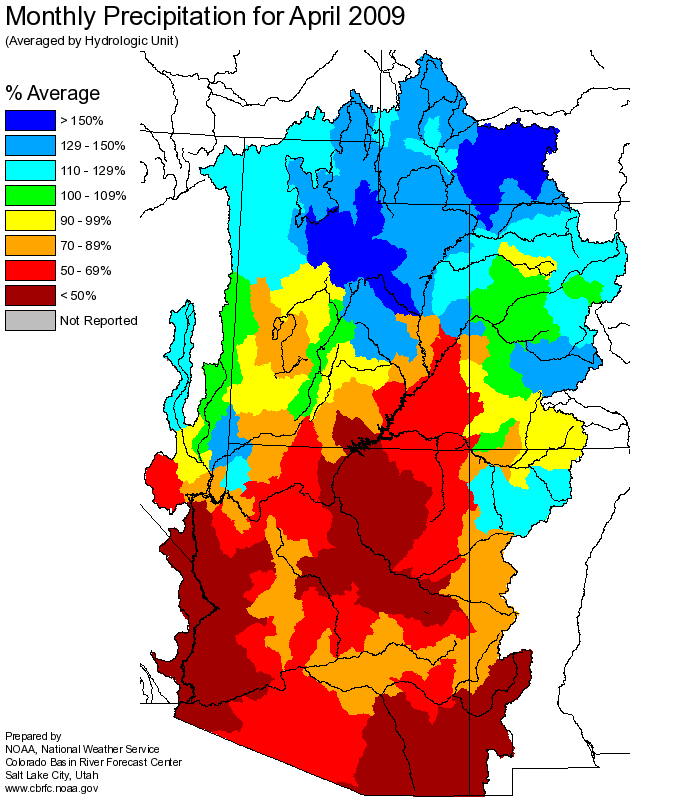
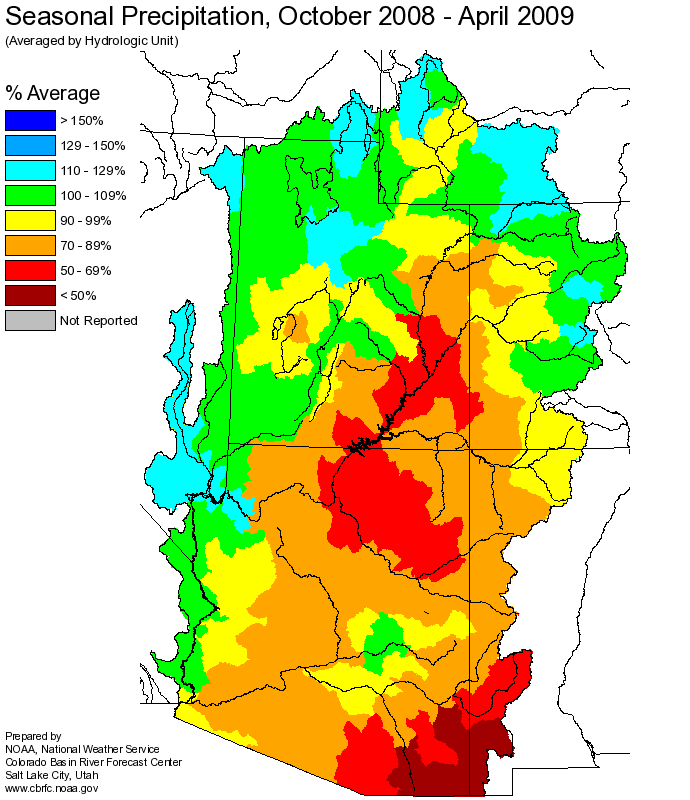
The entire Great Basin received much above average precipitation during April 2009. Monthly totals were 144%
and seasonal values were 110% of average. April departure from maximum temperatures were 1 to 5 degrees below normal while
minimum temperatures were slightly above normal. Overall we built snowpack during the month of April and then began melting it during the mid
and latter half of the month. Indexed snow totals were at their seasonal peak during the first week of May and on May 1 were 107% of average in the Weber and Ogden basins,
108% in the Provo, 100% in the Bear and 120% in the Six Creeks drainages. Overall, April precipitation improved water supply conditions.
-Soil Moisture & Streamflow... Modeled
soil
moisture has been dry this season due to dry conditions during the late summer and fall of 2008. Model guidance all year
has suggested it will lower volumes in 2009. Stream flow on the Weber, Provo and Bear rivers were 134%, 112% and 110% of average.
-Short Term Precipitation Forecasts...
Weather guidance from
National Weather Service Meteorological Models
show mostly average temperature and precipitation conditions during the first 6-10 days of May. Flow is currently zonal which will bring seasonal
temperatures, which moderate conditions helping to slowly, instead of quickly, melt the snowpack.
Short term
CPC guidance shows a slight shift to warmer and dryer
conditions for the second half of May which will accelerate the melt of snowpacks.
-General Discussion...
Longer range predictions from NOAA's Climate Prediction Center are still factoring in a weak
La Nina
episode, predicted to last through the spring of 2009. Please reference the web link above for further details and effects within the Great Basin.
-Volumetric forecasts... Currently May through July forecast are average to above average reflecting the above average monthly conditions during April.
April through July volume were dervived by summing observed April flows to the May through July forecasts. Median Forecast have now increased
between 5-20% by volume.
-Great Basin Elevation...
Current ESP estimates for the 2009 GSL maximum summer elevation are 4194.97 ft and we expect the Salt Lake Marina's maximum elevation to reach 1 to 1.5 feet
higher than the Saline value in late June. The Saline gage as of May 1st was reading 4194.51 ft. and the harbor gage was reading 4195.81 ft. above mean sea level.
The minimum elevation at Saline between May 1 and October 1 is forecast to be 4192.7 ft.
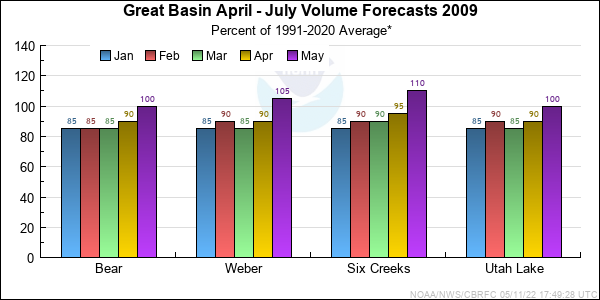
*Median of forecasts within each basin.
Bear Basin Conditions
-Snow Water Equivalent & Precipitation...
Monthly precipitation was 135% of average and
snow
water equivalent increased to 100% of average. Seasonal precipitation rose last month to 110% of average.
-Streamflow...
Observed streamflows for Bear at the UT/WY State line were 110% of average. These flows contributed to Woodruff Narrows Reservoir
completely filling and spilling began on April 21. Observed flows on the Logan River nr Logan above State Dam were also near normal at 97% of average.
-Short Term Precipitation Forecasts...
Weather guidance from
National Weather Service Meteorological Models
show mostly average temperature and precipitation conditions during the first 6-10 days of May. Flow is currently zonal which will bring seasonal
temperatures, which moderate conditions helping to slowly, instead of quickly, melt the snowpack.
Short term
CPC guidance shows a slight shift to warmer and dryer
conditions for the second half of May which will accelerate the melt of snowpacks.
-General Discussion...
May through July forecast ranged from 89% of average on the Bear at Monpelier to 105% on the Logan Nr State Dam.
Volumetric forecast for April through July range from 78% at Bear River nr Montpelier to 115% of average at Little Bear River near Paradise.
The median April through July forecast is 98% of average, with a range from 78% t0 115% of average.
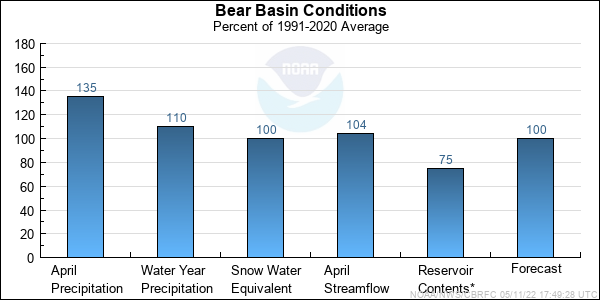
* Percent usable capacity, not percent average contents.
Click for multi-month Graph.
Weber Basin Conditions
-Snow Water Equivalent and Precipitation...
Very wet condtions prevailed during April across the Weber basin. Monthly precipiation for the Weber and Ogden basins totalled 148% of average and improved seasonal
numbers to 106% of average.
Snow
water equivalent numbers peaked during April and as of May 1st were 107% of average.
-Streamflow...
Streamflows were 112% of average for the Weber at Oakley, 114% for the Weber at Rockport, 132% for the Weber at Echo Reservoir. Melt began during May but several
storms brought additional snows and slowed or shut down the melt.Temperature departures from the daily maximums were 1-5 degrees below normal last month and held
back the melt.
-Short Term Precipitation Forecasts ...
Weather guidance from National Weather Service Meteorological Models
show mostly average temperature and precipitation conditions during the first 6-10 days of May. Flow is currently zonal which will bring seasonal
temperatures, which moderate conditions helping to slowly, instead of quickly, melt the snowpack. Short term CPC guidance
shows a slight shift to warmer and dryer conditions for the second half of May which will accelerate the melt of snowpacks.
-General Discussion ...
May through July residual forecast ranged from 100% to 122% of average, with Rockport Reservoir coming in at 122% of average. Monthly streamflow observation were added to these May through
July forecast to come up with new April thorugh July volumes and for example, using East Canyon Reservoir is now 116% of average. The median April through July forecast is now 106% of
average and the range is 91% to 118% of average.
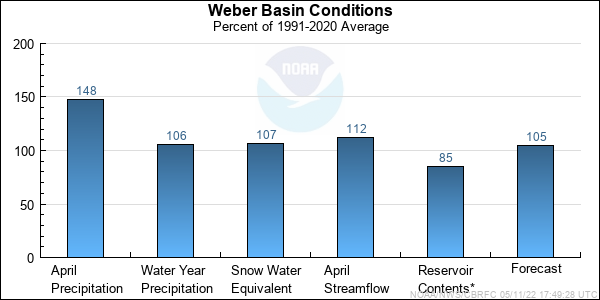
* Percent usable capacity, not percent average contents.
Click for multi-month Graph.
Six Creeks Basin Conditions
-Snow Water Equivalent & Precipitation...
The Six Creeks drainages received an amazing 169% of average monthly precipitation during April. Many of our snow stations reached their peak season snow during mid April.
Snow water equivalent
as of May 1 was indexed at 108% of average. Seasonal precipitation totals climbed 7% percent to 120% of average.
-Streamflow...
Steam flows for both Big and Little Cottonwood canyons were near average during April. Big Cottonwoods monthly flow was 114% of average and Little Cottonwood ended the
month at 96% of average. Temperature departures from the daily maximums were 1-5 degrees below normal last month and held back the melt. Currently the upper elevations
on both canyons has greater than average peak seasonal snow.
-Short Term Precipitation Forecasts...
Weather guidance from
National Weather Service Meteorological Models
show mostly average temperature and precipitation conditions during the first 6-10 days of May. Flow is currently zonal which will bring seasonal
temperatures, which moderate conditions helping to slowly, instead of quickly, melt the snowpack. Short term
CPC guidance
shows a slight shift to warmer and dryer conditions for the second half of May which will accelerate the melt of snowpacks.
-General Discussion...
May through July volume forecasts ranged from 97% to 154% of average with a median of 112% of average . Observations and or estimates from April were added to the May through July
forecast to then calculate the April through July volumes. Currently the range of April through July forecasts range from 100%-125% of average with a median for Six Creeks of 108% of average.
City Creek near Salt Lake City is currently forecast at 118% of average for the April through July period.
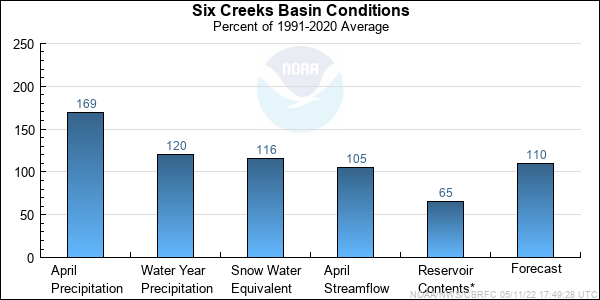
* Percent usable capacity, not percent average contents.
Click for multi-month Graph.
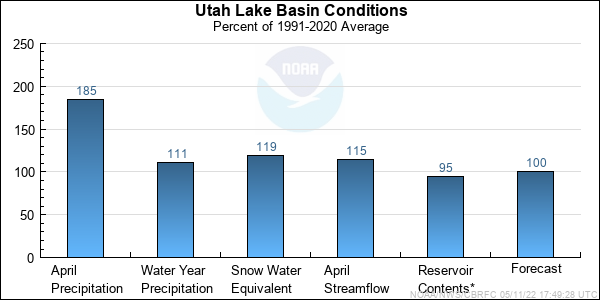
Utah Lake Basin Conditions
-Snow Water Equivalent & Precipitation...
The drainages that contribute to Utah Lake saw monthly precipitation numbers at 185% of average.
Snow
water equivalent reached their seasonal peak in mid April at and finished the month at 108% of average. Seasonal precipitation increase last month to 111% of average.
-Streamflow...
Stream flow in the upper reaches of the Provo River was much above average this month. The Provo at Woodland came in at 134% of the 30 year average.
Temperature departures from the daily maximums were 1-5 degrees below normal last month and held back the melt.
-Short Term Precipitation Forecasts...
Weather guidance from
National Weather Service Meteorological Models
show mostly average temperature and precipitation conditions during the first 6-10 days of May. Flow is currently zonal which will bring seasonal
temperatures, which moderate conditions helping to slowly, instead of quickly, melt the snowpack. Short term
CPC guidance
shows a slight shift to warmer and dryer conditions for the second half of May which will accelerate the melt of snowpacks.
-General Discussion...
May through July forecasts averaged from 100% to 107% with a median of 100% of average. The April through July forecasts were calculated by adding April observed or estimated
values and ranged from 100% to 108% of average with a median of 102% of average. Inflow for Utah Lake is now forecast to be 108% of average.
* Percent usable capacity, not percent average contents.
Click for multi-month Graph.
Differences between the full period forecasts and the residual forecasts may not exactly equal the actual observed volumes due to rounding conventions (see Definitions section).
Precipitation Maps
Hydrologist: B.Bernard
