Note: This publication is currently undergoing major revisions. The current publication will be replaced with a new publication based on stakeholder requirements and scientific advances. We expect to begin sharing details on this soon. If you have input on content, format, or publication frequency at any time, please contact us at cbrfc.webmasters@noaa.gov.Great Basin Water Supply Outlook, June 1, 2009Great Basin Water Supply Outlook, June 1, 2009
Contents
Great Basin Summary
-Snow Water Equivalent & Precipitation...
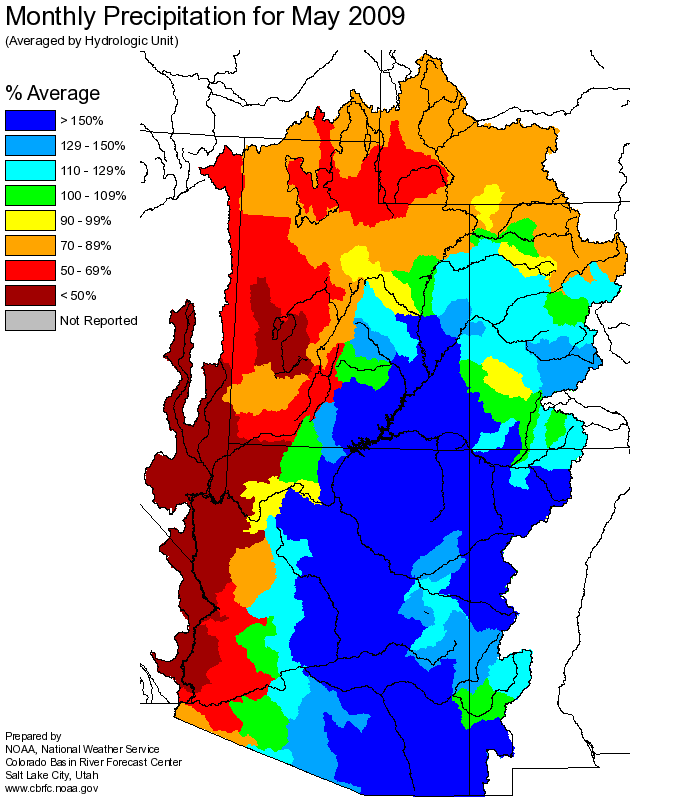
The Great Basin received below average precipitation during May 2009. Monthly totals were 70% of average. May departures from minimum temperature
were 1-5 degrees above normal but the real story occurred during the second week of May when Northern Utah
maximum temperatures were 10-18 degrees above normal. This week of very high temperatures peaked flows on rivers across the basin. Indexed snow totals were were less than 10% of average
at all locations. As of early June the snow pack is nearly gone with the only remnants remaining on northerly facing slopes above 10,000 ft. Snow graphs indicate that in some places
the melt occurred 20-30 days earlier than normal.
-Soil Moisture & Streamflow... Stream flow on the Weber, Provo and Bear rivers were 141%, 161% and 118% of average. These high flows were
in the top 10 record May flow number rankings according to the USGS. Despite the high inflow volumes, outflow from the numerous reservoirs across the GSL basin were managed well and most reservoirs
are now full ensuring water supplies are at their maximum for summer 2009. A forseable consequence of the early melt is that stream flow will now rapidly decline for the remainder of the April through July period.
Streamflow models currently indicate that flows will likely be 40-60% of their normal monthly average for June and July.
-Short Term Precipitation Forecasts...
Weather guidance from
National Weather Service Meteorological Models
show above average precipitation and below average temperature conditions during the first 6-10 days of June. Meteorological models on June 8, indicate
the Great Basin will remain under a moist southwest flow regime through June 17, 2009. Short term
Climate Prediction Center guidance
shows a slight shift to above average temperatures and below average precipitaiton conditions for the second half of June, 2009.
-General Discussion...
Longer range predictions from NOAA's Climate Prediction Center are now suggesting a transition from ENSO-neutral conditions to
El Nino
conditions during June-August 2009. Please reference this CPC
web link for further details and
effects in the intermountain region.
-Volumetric forecasts... June through July forecast for the Great Basin areas basins are average to much below average reflecting the dry and warm conditions encountered
during May, the early melt of snowpacks and last years dry soil moisture states that are decreasing in channel stream flows.
April through July volume were dervived by summing observed April and May flows (where available) to the June through July volumetric forecasts. A-J values will be update
as we review and revise observed streamflow values throughout summer and fall.
-Great Basin Elevation...
Current ESP estimates for the 2009 GSL maximum summer elevation are 4194.68 ft, a decrease of 2 tenths. We expect the Salt Lake Marina's maximum elevation to reach 1 to 1.5 feet
higher than the Saline value in late June. The Saline gage as of June 4th was reading 4194.60 ft. and the harbor gage was reading 4195.71 ft.
The minimum elevation at Saline between May 1 and October 1 is forecast to be 4192.3 ft. Winds can and do affect daily readings depending on the
direction, strength and duration of winds across the lake. This summer maximum elevation should occur this month unless we encounter a near record heavy or widespread precipitation event which
is very unlikely.
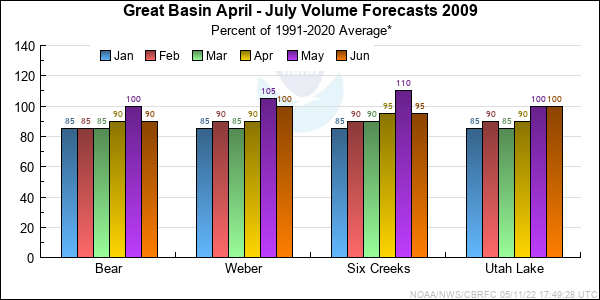
*Median of forecasts within each basin.
Bear Basin Conditions
-Snow Water Equivalent & Precipitation...
Monthly precipitation was was below normal during May at 74% of average.
Snow
water equivalent index values are 4% of average as of June 8th. This represents the melting of snow nearly 20 days earlier than normal. Seasonal precipitation decreased to 103% of average due to our dry May conditions.
-Streamflow...
Observed streamflows for Bear at the UT/WY State line were 158% of average. Inflows to Woodruff Narrows Reservoir however (unregulated) were 118% of average showing a loss for the reach. Observed flows on the Logan River
nr Logan above State Dam were also lower than expected at 113% of average respectively. We currently surmise that dry soils, unaccounted for diversions and usage of the Bear coupled with warm temperatures,
decreased the flows in this location, however we are not sure of the exact cause of the loss.
These lower than expected flows will likely decrease the total April through July volumes when year end verification occurs. Currently June and July volumes are expected to be below normal since the the high elevation snow
that normally drives June and July flows is gone.
-Short Term Precipitation Forecasts...
Weather guidance from
National Weather Service Meteorological Models
show above average precipitation and below average temperature conditions during the first 6-10 days of June. Meteorological models on June 8, indicate
the Great Basin will remain under a moist southwest flow regime through June 17, 2009. Short term
Climate Prediction Center guidance
shows a slight shift to above average temperatures and below average precipitaiton conditions for the second half of June, 2009.
-General Discussion...
Longer range predictions from NOAA's Climate Prediction Center are now suggesting a transition from ENSO-neutral conditions to
El Nino
conditions during June-August 2009. Please reference this CPC
web link for further
details and effects in the intermountain region.
June through July forecast ranged from 59% of average for Hyrum Reservoir to 90% on the Smith Fork River Nr WY/ID Border.
The median June through July forecast is 62% of average. The median April through July forecast was 89% of average.
Please note that forecast at Woodruff Narrows Reservoir and Stewart Dam are REGULATED inflows, meaning they reflect only observed streamflows and are not corrected for
diversions and storage upstream. Given the nature of these forecast points you cannot corrolate them with upstream forecasts.

* Percent usable capacity, not percent average contents.
Click for multi-month Graph.
Weber Basin Conditions
-Snow Water Equivalent and Precipitation...
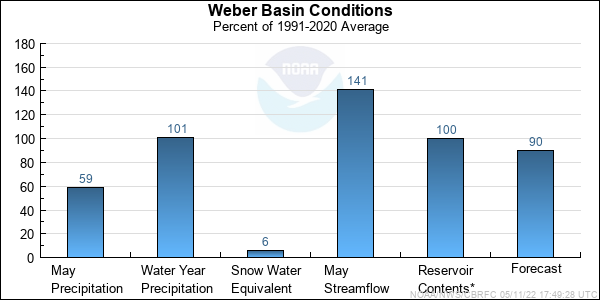
Dry condtions prevailed during May across the Weber basin. Monthly precipitation for the Weber and Ogden basins totalled 59% of average and decreasing seasonal
numbers to 101% of average.
Snow
water equivalent index values are 4% of average (June 8), melting nearly 20 days earlier than normal.
-Streamflow...
Streamflows were 141% of average for the Weber at Oakley, 94% for the Weber at Rockport, 110% for the Weber at Echo Reservoir. Despite the high inflow volumes last month, outflow from the numberous reservoirs
in the Weber basin were managed well and all reservoirs in this basin are now full ensuring water supplies are at their maximum for summer 2009
-Short Term Precipitation Forecasts...
Weather guidance from National Weather Service Meteorological Models
show above average precipitation and below average temperature conditions during the first 6-10 days of June. Meteorological models on June 8, indicate
the Great Basin will remain under a moist southwest flow regime through June 17, 2009. Short term Climate Prediction Center guidance
shows a slight shift to above average temperatures and below average precipitaiton conditions for the second half of June, 2009.
-General Discussion...
Longer range predictions from NOAA's Climate Prediction Center are now suggesting a transition from ENSO-neutral conditions to
El Nino
conditions during June-August 2009. Please reference this CPC web link for further details
and effects in the intermountain region.
June through July residual forecasts ranged from 60% to 79% of average. The median June through July forecast was 70% of
average. The April through July Forecast for Weber at Oakley is now 100% of average.
* Percent usable capacity, not percent average contents.
Click for multi-month Graph.
Six Creeks Basin Conditions
-Snow Water Equivalent & Precipitation...
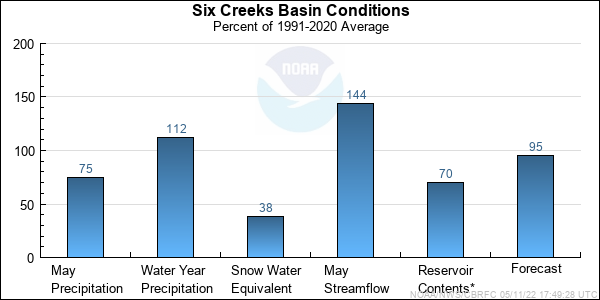
The Six Creeks drainages received 75% of average monthly precipitation during May. June 1st SWE was 38% of average
Snow water equivalent
index values are currently 26% of average (June 8), and is melting away nearly 20 days earlier than normal. Only sites above 10,000 feet on north facing slopes are showing any SWE at this time.
Seasonal precipitation dropped from 120% to 112% of average. Warmer than average temperatures for May and below average precipitation are the cause of the current snow states.
-Streamflow...
Steam flows for both Big and Little Cottonwood canyons were above average during May. Big Cottonwoods monthly flow was 152% of average and Little Cottonwood ended the
month at 137% of average. Peak flows occurred during the third week of May. We currently expect flows for June and July to be near average based on modelled output.
-Short Term Precipitation Forecasts...
Weather guidance from
National Weather Service Meteorological Models
show above average precipitation and below average temperature conditions during the first 6-10 days of June. Meteorological models on June 8, indicate
the Great Basin will remain under a moist southwest flow regime through June 17, 2009. Short term
Climate Prediction Center guidance
shows a slight shift to above average temperatures and below average precipitaiton conditions for the second half of June, 2009.
-General Discussion...
Longer range predictions from NOAA's Climate Prediction Center are now suggesting a transition from ENSO-neutral conditions to
El Nino
conditions during June-August 2009. Please reference this CPC
web link for further details and effects in the intermountain region.
June through July volume forecasts ranged from 77% to 90% of average with a median of 79% of average. Observations and or estimates from April and May were added to the June through July
forecast to then calculate the April through July volumes. Dry weather and declining snow packs caused a decrease in the forecasted April through July volumes in some locations.
The average of all April through July volume forecasts was 95% of average.
* Percent usable capacity, not percent average contents.
Click for multi-month Graph.
Utah Lake Basin Conditions
-Snow Water Equivalent & Precipitation...
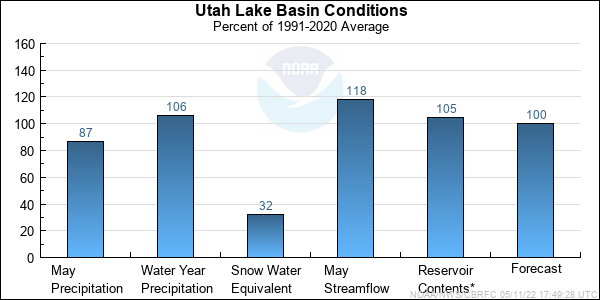
Utah Lake monthly precipitation was below normal at 87% of average. On June 1st the indexed snow was 38% of average.
Snow
water equivalent index values now are 13% of average (June 8), melting nearly 20 days earlier than normal. This rapid melt is in response to unseasonably warm temperatures for 3 weeks
in May. Seasonal precipitation now totals 106% of average.
-Streamflow...
Stream flow in the upper reaches of the Provo River were much above normal for May at 161% of average at the Woodland gage. This value ranked Provo - Woodland as the 4th highest month flow ever recorded
since records have been kept. June and July forecast indicated flows will decrease to below average but given the very high April and May volumes for the period, April through July should be
at or above average for the period.
-Short Term Precipitation Forecasts...
Weather guidance from
National Weather Service Meteorological Models
show above average precipitation and below average temperature conditions during the first 6-10 days of June. Meteorological models on June 8, indicate
the Great Basin will remain under a moist southwest flow regime through June 17, 2009. Short term
Climate Prediction Center guidance
shows a slight shift to above average temperatures and below average precipitaiton conditions for the second half of June, 2009.
-General Discussion...
Longer range predictions from NOAA's Climate Prediction Center are now suggesting a transition from ENSO-neutral conditions to
El Nino
conditions during June-August 2009. Please reference this CPC
web link for further details and effects in the intermountain region.
June through July forecasts ranged from 67% to 92% with a median of 68% of average. The April through July forecasts were calculated by adding April, May observed and or estimated flows to June,
July forecasts. The April through July median forecast for the Utah Lake Basin was 98% of average.
* Percent usable capacity, not percent average contents.
Click for multi-month Graph.
Differences between the full period forecasts and the residual forecasts may not exactly equal the actual observed volumes due to rounding conventions (see Definitions section).
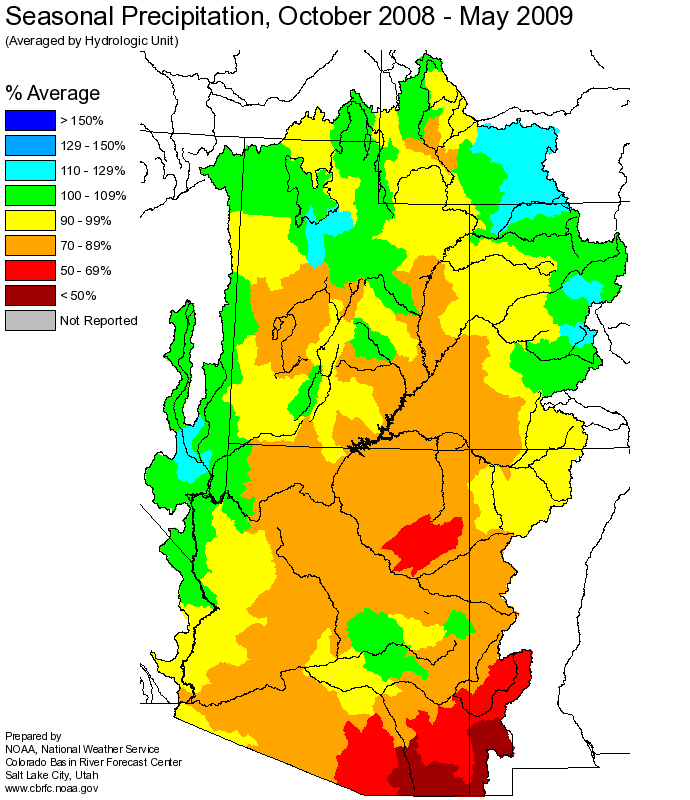
Precipitation Maps
Hydrologist: B.Bernard
