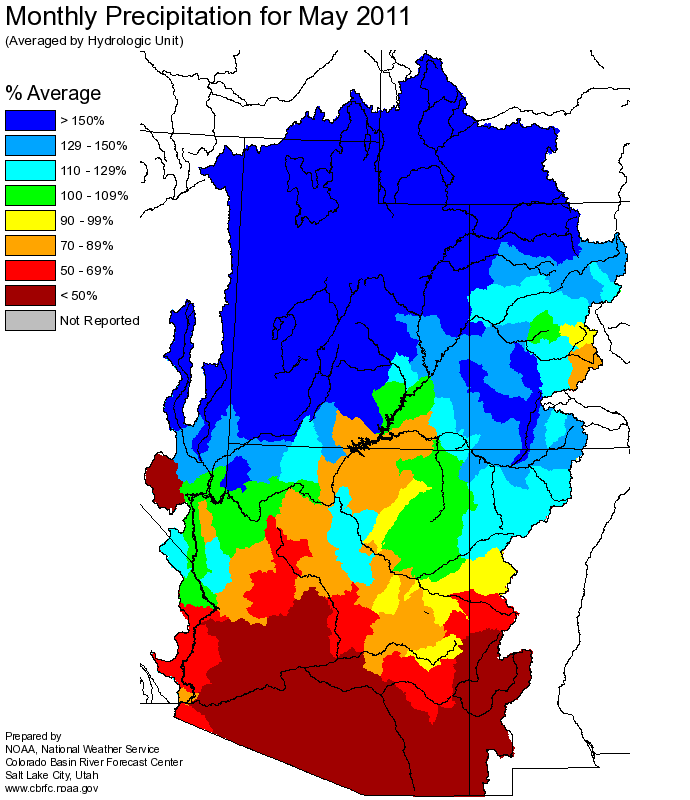
NOAA, National Weather Service
Colorado Basin River Forecast Center
Salt Lake City, Utah
www.cbrfc.noaa.gov
| Prepared by B.Bernard NOAA, National Weather Service Colorado Basin River Forecast Center Salt Lake City, Utah www.cbrfc.noaa.gov |
| Forecast Period | 90% Exceedance Volume | 50% Exceedance Volume | Percent Average | 10% Exceedance Volume | |
| Bear | |||||
| Utah | April-July | 210 | 225 | 199 | 240 |
| June-July | 175 | 190 | 271 | 205 | |
| Woodruff Narrows Res * | April-July | 340 | 360 | 265 | 375 |
| June-July | 220 | 240 | 224 | 255 | |
| Montpelier, Nr, Stewart Dam, Blo * | April-July | 560 | 595 | 253 | 630 |
| June-July | 325 | 350 | 318 | 375 | |
| Big Ck | |||||
| Randolph, Nr | April-July | 15.3 | 15.9 | 331 | 16.7 |
| June-July | 6.7 | 7.4 | 336 | 8.1 | |
| Smiths Fork | |||||
| Border, Nr | April-July | 161 | 167 | 162 | 173 |
| June-July | 119 | 125 | 205 | 131 | |
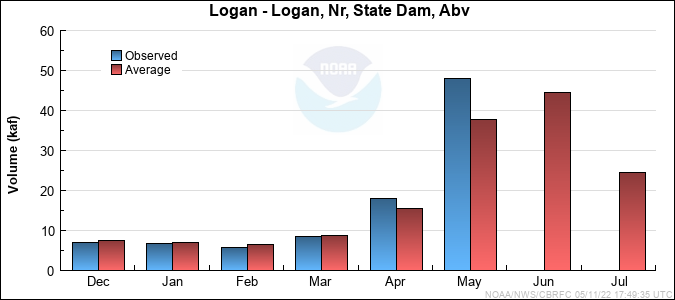
| Logan | |||||
| Logan, Nr, State Dam, Abv | April-July | 225 | 235 | 187 | 245 |
| June-July | 157 | 170 | 243 | 183 | |
| Blacksmith Fork | |||||
| Hyrum, Nr, Upnl Dam, Abv | April-July | 111 | 120 | 250 | 135 |
| June-July | 45 | 53 | 265 | 61 | |
| Little Bear | |||||
| Paradise | April-July | 90 | 102 | 222 | 114 |
| June-July | 37 | 40 | 294 | 43 |
| Forecast Period | 90% Exceedance Volume | 50% Exceedance Volume | Percent Average | 10% Exceedance Volume | |
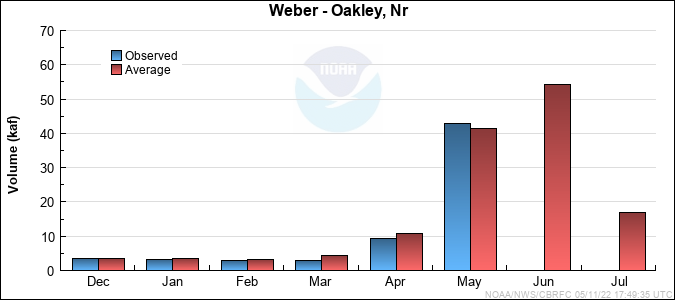
| Weber | |||||
| Oakley, Nr | April-July | 210 | 230 | 187 | 250 |
| June-July | 156 | 177 | 249 | 198 | |
| Rockport Res, Wanship, Nr | April-July | 255 | 270 | 196 | 285 |
| June-July | 176 | 185 | 257 | 195 | |
| Coalville, Nr | April-July | 265 | 280 | 203 | 300 |
| June-July | 175 | 184 | 263 | 199 | |
| Chalk Ck | |||||
| Coalville | April-July | 110 | 116 | 258 | 125 |
| June-July | 52 | 60 | 349 | 68 | |
| Weber | |||||
| Echo Res, Echo, At | April-July | 360 | 380 | 211 | 400 |
| June-July | 210 | 220 | 265 | 240 | |
| Lost Ck | |||||
| Lost Ck Res, Croydon, Nr | April-July | 27 | 43 | 244 | 49 |
| June-July | 12.6 | 15 | 326 | 17 | |
| East Canyon Ck | |||||
| Jeremy Ranch, Nr | April-July | 40 | 44 | 310 | 48 |
| June-July | 12.8 | 16 | 364 | 19.2 | |
| East Canyon Res, Morgan, Nr | April-July | 71 | 74 | 239 | 77 |
| June-July | 27 | 30 | 319 | 33 | |
| Weber | |||||
| Gateway | April-July | 765 | 800 | 225 | 835 |
| June-July | 385 | 400 | 317 | 435 | |
| Sf Ogden | |||||
| Huntsville, Nr | April-July | 128 | 131 | 205 | 136 |
| June-July | 42 | 48 | 296 | 54 | |
| Ogden | |||||
| Pineview Res, Ogden, Nr | April-July | 245 | 285 | 214 | 410 |
| June-July | 90 | 100 | 333 | 111 | |
| Wheeler Ck | |||||
| Huntsville, Nr | April-July | 6.7 | 8.7 | 138 | 11.3 |
| June-July | 6.1 | 7.4 | 352 | 8.7 | |
| Centerville Ck | |||||
| Centerville,nr, Div,abv | April-July | 3.1 | 3.6 | 203 | 4.1 |
| June-July | 0.53 | 1.7 | 272 | 2.9 |
| Forecast Period | 90% Exceedance Volume | 50% Exceedance Volume | Percent Average | 10% Exceedance Volume | |
| Little Cottonwood Ck | |||||
| Salt Lake City, Nr | April-July | 57 | 60 | 150 | 63 |
| June-July | 50 | 52 | 200 | 54 | |
| Big Cottonwood Ck | |||||
| Salt Lake City, Nr | April-July | 57 | 62 | 163 | 67 |
| June-July | 43 | 46 | 219 | 49 | |
| Mill Ck | |||||
| Salt Lake City, Nr | April-July | 11.5 | 12.9 | 184 | 14.3 |
| June-July | 8 | 8.7 | 242 | 9.4 | |
| Dell Fk | |||||
| Little Dell Res | April-July | 14.1 | 14.7 | 216 | 15.2 |
| June-July | 5.1 | 5.7 | 339 | 6.3 | |
| Parleys Ck | |||||
| Salt Lake City, Nr | April-July | 33 | 35 | 210 | 37 |
| June-July | 15 | 16 | 276 | 17 | |
| Emigration Ck | |||||
| Salt Lake City, Nr | April-July | 9.5 | 9.9 | 220 | 10.1 |
| June-July | 3.6 | 4 | 323 | 4.4 | |
| City Ck | |||||
| Salt Lake City, Nr | April-July | 16.1 | 18.1 | 208 | 20 |
| June-July | 11 | 13 | 310 | 15 | |
| Vernon Ck | |||||
| Vernon, Nr | April-June | 1.6 | 2.5 | 169 | 3.4 |
| June-July | 0.99 | 1.3 | 232 | 1.7 | |
| S Willow Ck | |||||
| Grantsville, Nr | April-July | 7 | 8.2 | 256 | 9.4 |
| June-July | 4.3 | 6 | 331 | 7.8 | |
| Dunn Ck | |||||
| Park Valley, Nr | April-July | 3.2 | 5 | 161 | 6.8 |
| June-July | 2 | 3.6 | 217 | 5 |
| Forecast Period | 90% Exceedance Volume | 50% Exceedance Volume | Percent Average | 10% Exceedance Volume | |
| Spanish Fork | |||||
| Castilla, Nr | April-July | 162 | 166 | 216 | 170 |
| June-July | 71 | 75 | 288 | 78 | |
| Provo | |||||
| Woodland, Nr | April-July | 167 | 174 | 169 | 181 |
| June-July | 123 | 130 | 250 | 137 | |
| Hailstone, Nr | April-July | 192 | 198 | 182 | 205 |
| June-July | 133 | 140 | 264 | 148 | |
| Deer Ck Res | April-July | 235 | 245 | 194 | 255 |
| June-July | 153 | 160 | 286 | 170 | |
| American Fork | |||||
| American Fork, Nr, Up Pwrplnt, Abv | April-July | 59 | 62 | 194 | 67 |
| June-July | 47 | 50 | 250 | 53 | |
| West Canyon Ck | |||||
| Cedar Fort, Nr | April-July | 5 | 5.9 | 257 | 6.8 |
| June-July | 2.7 | 3.2 | 294 | 3.7 | |
| Salt Ck | |||||
| Nephi | April-July | 18 | 22 | 167 | 28 |
| June-July | 10 | 11 | 200 | 12.2 | |
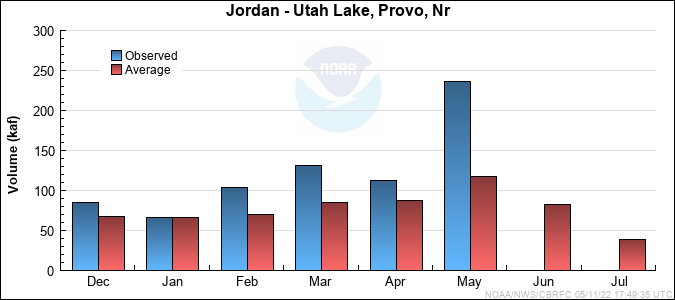
| Jordan | |||||
| Utah Lake, Provo, Nr | April-July | 845 | 865 | 262 | 900 |
| June-July | 405 | 425 | 348 | 460 |
| Range | Round to | |
| 0-1.99 | 0.01 | |
| 2.0-19.9 | 0.1 | |
| 20-199 | 1.0 | |
| 200-999 | 5.0 | |
| 1000+ | 3 significant digits |