New 1981-2010 Averages being used this year.
Note: This publication is currently undergoing major revisions. The current publication will be replaced with a new publication based on stakeholder requirements and scientific advances. We expect to begin sharing details on this soon. If you have input on content, format, or publication frequency at any time, please contact us at cbrfc.webmasters@noaa.gov.Great Basin Water Supply Outlook, June 1, 2012Great Basin Water Supply Outlook, June 1, 2012
Contents
Great Basin Summary

*Median of forecasts within each basin.
Bear Basin Conditions
The following conditions influenced this month's forecasts:
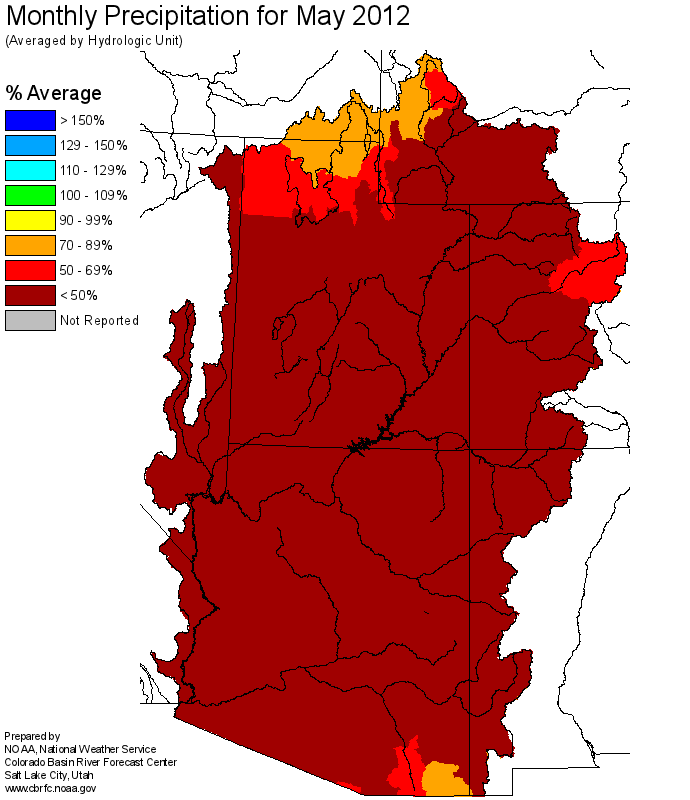
Precipitation:
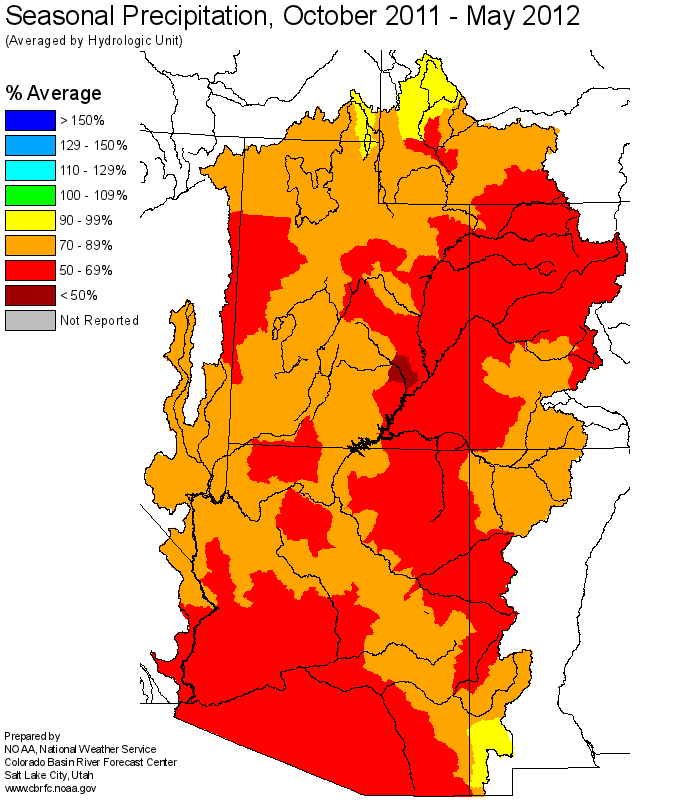
Seasonal October through May
precipitation was 82 percent of average
in the upper Bear Basin.
May
precipitation was 66 percent of average.
Streamflow:
The Bear River at Utah/Wyoming Stateline last month was 76 percent of average. The regulated inflow to Bear River at Stewart Dam was 6 percent of average. The Logan River above State Dam
was estimated at 73 percent of average streamflow.
Snowpack:
As of June 1st the Bear Basin snowpack has melted out in one of the earliest melts we've seen.
As of water year 2012 the CBRFC has re-calculated all snow stations to reflect the new 30 year average from 1981-2010.
Upper Bear River Basin
Snow Plot.
Bear River Below Woodruff Narrows Reservoir
Snow Plot.
Bear River Basin
Snow Plot.
Soil Moisture:
Modeled Soil
Moisture, click on map to zoom.
Climate Forecasts:
Climate forecasts were not a factored into the northern Utah forecasts because there is not a strong correlation between
La Nina conditions and winter precipitation.
Forecast Summary:
Overall the winter of 2012 has been drier and warmer than average. Seasonal precipitation throughout the Bear Basin as of June 1 was 82
percent of average. Indexed snow water equivalents on June 1st were zero, indicating that in terms of runoff, the snow is now gone.
Streamflow forecast have been reduced significantly since March, as warm temperature and below average precipitation numbers have drastically reduced streamflow volume forecast.
The June through July forecasts are now ranked in the top 5 lowest years on record.
April through July seasonal volume forecast range from 21 to 56 percent of average with a median volume of 51 percent of average.

* Percent usable capacity, not percent average contents.
Click for multi-month Graph.
Weber Basin Conditions
The following conditions influenced this month's forecasts:
Precipitation:
Seasonal October through May
precipitation is 72 percent of
average.
May
precipitation was 52 percent of average.
Streamflow:
The Weber at Oakley gage was estimated to be 67 percent of average. The inflow to Rockport Reservoir was 47 percent of average.
Snowpack:
As of June 1st the snowpack is all but gone except on the highest peaks and runoff has finished. The current snow water equivalent index is zero percent of average.
As of water year 2012 the CBRFC has re-calculated all snow stations to reflect the new 30 year average from 1981-2010.
Weber River Basin
Snow Plot.
Upper Weber River Basin
Snow Plot.
Soil Moisture:
Modeled Soil
Moisture, click on map to zoom.
Climate Forecasts:
Climate forecasts were not a factored into the northern Utah forecasts because there is not a strong correlation between
La Nina conditions and winter precipitation.
Forecast Summary:
Overall the winter of 2012 has been drier and warmer than average and resulted in very low streamflows. Seasonal precipitation throughout the Weber River Basin as of June 1 was 72
percent of average. Indexed snow water equivalents on June 1st indicated that in terms of runoff, the snow is now gone.
Streamflow forecast have been reduced significantly since March, as warm temperature and below average precipitation numbers have drastically reduced streamflow volume forecast.
The June through July Weber Basin forecasts ranked in the top 5 lowest historical years on record.
April through July seasonal volume forecasts range
between 28 and 52 percent of average with a median forecast volume of 37 percent of average. Here's hoping for a wet summer and a much better water year 2013.

* Percent usable capacity, not percent average contents.
Click for multi-month Graph.
Six Creeks Basin Conditions
The following conditions influenced this month's forecasts:
Precipitation:
Seasonal October through May
precipitation was near 74 percent of average.
May
precipitation was 46 percent of average.
Streamflow:
May streamflow for City Creek near Salt Lake City was 47 percent of average. Big Cottonwood Creek nr Salt Lake City was 58 percent of average.
Snowpack:
As of June 1st the snowpack are all but gone with only residual snowfields at elevations above 10000 feet. The has now effectively ended in what will be recored in history as one of the earliest
melts ever. As of water year 2012 the CBRFC has re-calculated all snow stations to reflect the new 30 year average from 1981-2010.
Six Creeks Headwaters Basins
Snow Plot.
Big and Little Cottonwood Canyons
Snow Plot.
Soil Moisture:
Modeled Soil
Moisture, click on map to zoom.
Climate Forecasts:
Climate forecasts were not factored into the northern Utah forecasts because there is not a strong correlation between
La Nina conditions and winter precipitation.
Forecast Summary:
Overall the winter of 2012 has been drier and warmer than average resulting in very low streamflow volumes. Seasonal precipitation throughout the Weber River Basin as of June 1 was 74
percent of average. Indexed snow water equivalents on June 1st indicated that in terms of runoff, the snow is now gone.
Streamflow forecast have been reduced significantly since March, as warm temperature and below average precipitation numbers have drastically reduced streamflow volume forecast. Many of the June through July Six Creeks forecasts are now ranked near or in the top 10 lowest years on record.
April through July seasonal
volume forecasts range between 15 to 55 percent of average with a median forecast of 45 percent of average.

* Percent usable capacity, not percent average contents.
Click for multi-month Graph.
Utah Lake Basin Conditions
The following conditions influenced this month's forecasts:
Precipitation:
Seasonal October thought April
seasonal precipitation was 71 percent of average.
May
precipitation was 34 percent of average.
Streamflow:
Streamflows for the Provo at Woodland were 66 percent of average. Unregulated inflow to Utah Lake was 26 percent of average.
Snowpack:
As of June 1st the snowpack is all but gone and water year 2012 runoff is done. Current snow water equivalent measurements are zero at NRCS SNOTEL stations.
As of water year 2012 the CBRFC has re-calculated all snow stations to reflect the new 30 year average from 1981-2010.
Provo River, Utah Lake Drainage
Snow Plot.
Soil Moisture:
Modeled Soil
Moisture, click on map to zoom.
Climate Forecasts:
Climate forecasts were not factored into the northern Utah forecasts because there is not a strong correlation between
La Nina conditions and winter precipitation here.
Forecast Summary:
Overall the winter of 2012 has been drier and warmer than average resulting in significantly below average runoff. Seasonal precipitation throughout the Utah Lake and Provo River Basins as of June 1 was 71
percent of average. Indexed snow water equivalents on June 1st indicated that in terms of runoff, the snow is now gone.
Streamflow forecast have been reduced significantly since March, as warm temperature and below average precipitation numbers have drastically reduced streamflow volume forecast. Many of the June through July forecasts are now ranked in the top 10 lowest historical years on record.
April through July seasonal volume forecasts now range between
17 and 55 percent of average with a median forecast volume of 45 percent of average.

* Percent usable capacity, not percent average contents.
Click for multi-month Graph.
Differences between the full period forecasts and the residual forecasts may not exactly equal the actual observed volumes due to rounding conventions (see Definitions section).
Monthly Streamflows


Precipitation Maps
Hydrologist: B.Bernard
