The following conditions influenced this month's forecasts:
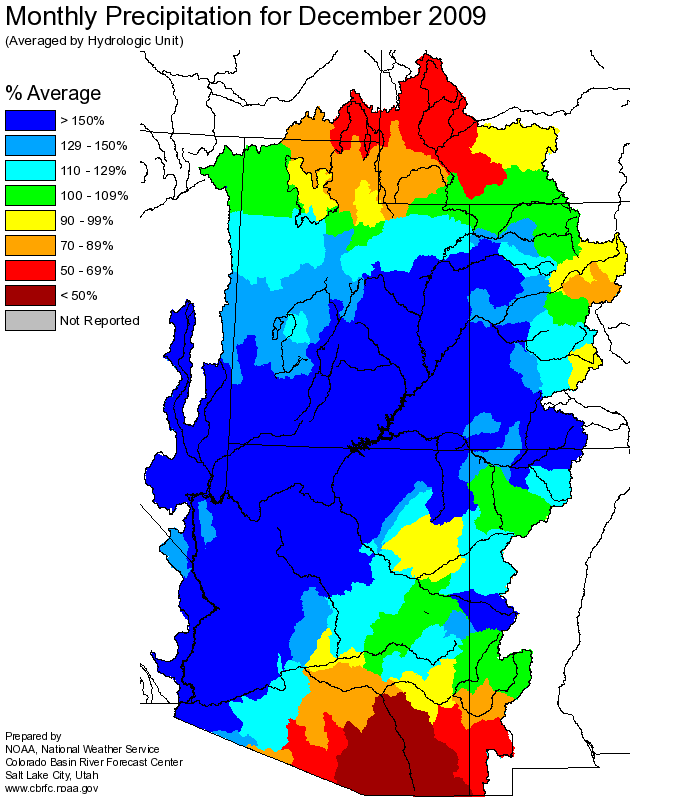
Precipitation:
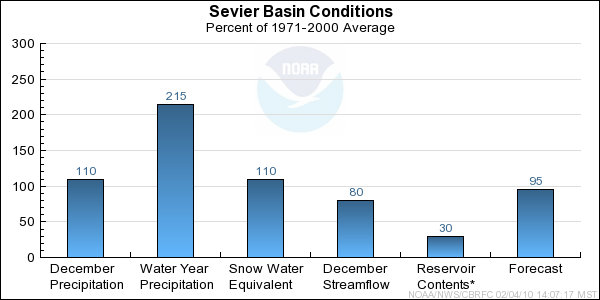
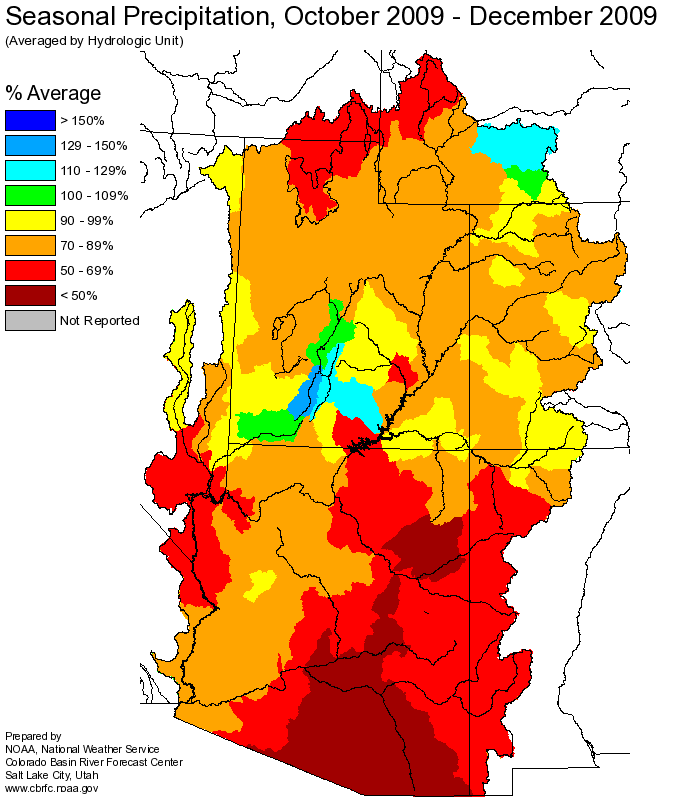
Seasonal October through December
precipitation was 110 percent of average in the Sevier River Basin.
December precipitation was 215 percent of average.
Streamflow:
December streamflow was 80 percent of average.
Snowpack:
January 1st snow water equivalent was near 110 percent of average in the basin as a whole.
Upper Sevier River Basin
Snow Plot.
Sevier River Basin
Snow Plot.
Soil Moisture:
Modeled Soil
Moisture, click on map to zoom. Soil moistures remain dry from last spring and summers warm and dry conditions.
Climate Forecasts:
El Nino climate conditions suggest increased chances for precipitation in this area.
The El Nino influence was not directly accounted for in the generation of these forecasts
as the above average snow conditions had already pushed the numbers to above average.
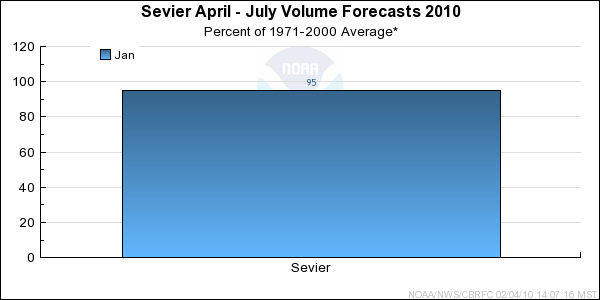
Forecast Summary:
Despite above average seasonal precipitation, the drier soil moisture conditions, combined
with above average snowpack resulted in forecast April through July volumes that are near average at this time.
Sevier River Basin forecast currently range between 80 and 110 percent of average with a median value of 95 percent of
average.
Differences between the full period forecasts and the residual forecasts may not exactly equal the actual observed volumes due to rounding conventions (see Definitions section).