Note: This publication is currently undergoing major revisions. The current publication will be replaced with a new publication based on stakeholder requirements and scientific advances. We expect to begin sharing details on this soon. If you have input on content, format, or publication frequency at any time, please contact us at cbrfc.webmasters@noaa.gov.Sevier Water Supply Outlook, March 1, 2010

Sevier Water Supply Outlook, March 1, 2010


Prepared by Brent Bernard
NOAA, National Weather Service
Colorado Basin River Forecast Center
Salt Lake City, Utah
www.cbrfc.noaa.gov

Contents

Sevier Summary


*Median of forecasts within each basin.


Sevier Basin Conditions

The following conditions influenced this month's forecasts:

Precipitation:
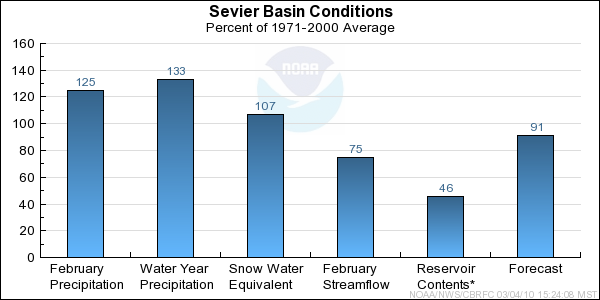
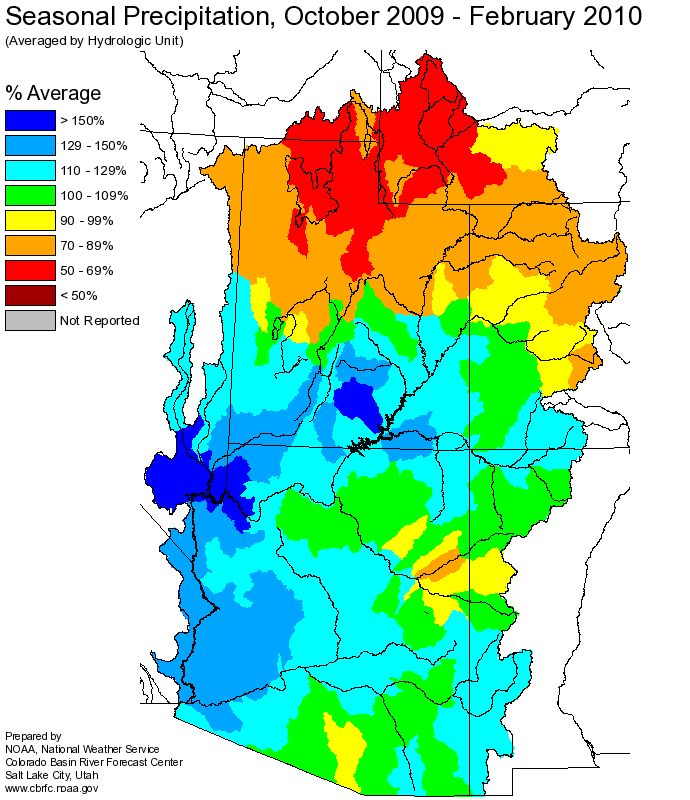
Seasonal October through February precipitation was 133 percent of average 
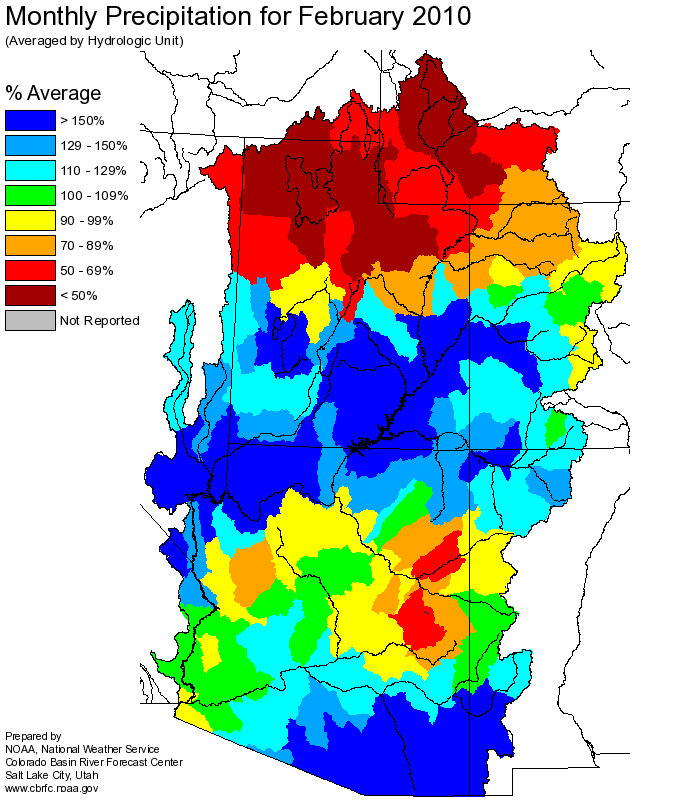
in the Sevier River Basin. February precipitation was 125 percent of average.

Streamflow:
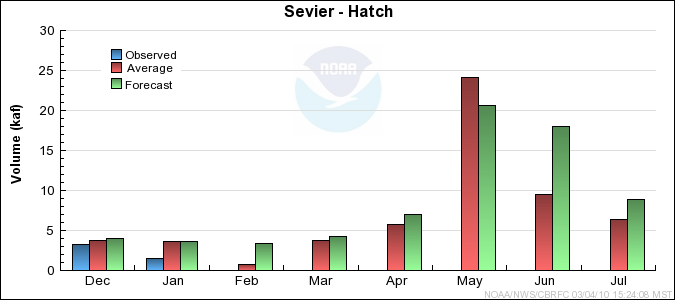
February streamflow estimates for the Sevier River at Hatch were 76 percent of average.

Snowpack:
March 1st snow water equivalent was near 107 percent of average in the basin as a whole. In the headwater regions the indexed total is 139 percent of average. In the lower basin, indexed snow along the Wasatch Plateau is currently near 69 percent of average.

Upper Sevier River Basin Snow Plot.
Sevier River Basin Snow Plot.
Lower Sevier River Basin Snow Plot.

Soil Moisture:
Modeled Soil Moisture, click on map to zoom. Soil moistures remain dry from last spring and summers warm and dry conditions.

Climate Forecasts:
El Nino climate conditions suggest increased chances for precipitation in this area. The El Nino influence was not directly accounted for in the generation of these forecasts.

Forecast Summary:
The Sevier Basin contines to have above average seasonal precipitation, paired with drier soil moisture conditions, a result of last years dry conditions. These conditions combined with much above average snowpack in the upper basin have increased the forecasted April through July volumes in the upper basin. However in the lower basin from Piute Reservoir north, namely along the central Wasatch Plateau, snowpacks are below average. 
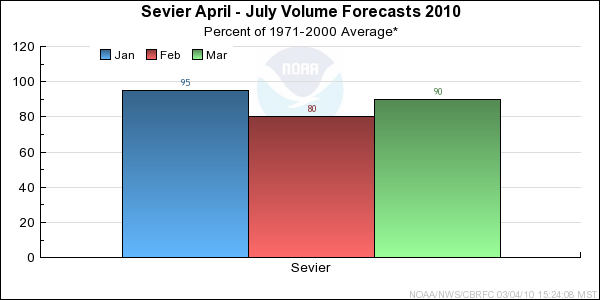
Sevier River Basin forecast currently range between 66 and 133 percent of average with a median value of 91 percent of average.


* Percent usable capacity, not percent average contents.
Click for multi-month Graph.


Sevier Specific Site Forecasts (kaf)

Click site name for graph.
Forecast
Period
90%
Exceedance
Volume
50%
Exceedance
Volume
Percent
Average
10%
Exceedance
Volume
Mammoth Ck
West Hatch Ditch, Abv April-July13.23011548
Sevier
Hatch April-July517012795
Kingston, Nr *April-July274413359
Ef Sevier
Kingston, Nr *April-July334011446
Sevier
Marysvale, Nr, Piute Dam, Blo *April-July6084127106
Clear Ck
Sevier, Nr, Diversions, Abv April-July14209131
Salina Ck
Emery, Nr April-July26.8769
Salina April-July2.3168142
Manti Ck
Manti, Nr, Dugway Ck, Blo April-July7126619
Sevier
Gunnison, Nr, San Pitch, Blo *April-July307571143
Chicken Ck
Levan, Nr April-July1.53.6807
Oak Ck
Oak City, Nr, Little Ck, Abv April-July0.781.4842.2
Beaver
Beaver, Nr April-July203011150
Minersville Res, Minersville, Nr April-July5.31810843
Coal Ck
Cedar City, Nr April-July132412436

*Regulated Forecast, i.e. Observed flow uncorrected for upstream diversion.
Differences between the full period forecasts and the residual forecasts may not exactly equal the actual observed volumes due to rounding conventions (see Definitions section).

Sevier End of Month Reservoir Contents (kaf)

Usable
Capacity
EOM
Contents
Percent
Usable
Capacity
Last Year
EOM
Last Year
%Capacity
untitled Otter Ck
Otter Creek Res, Antimony, Nr 52.5 24.0 46 29.3 56
untitled Sevier
Piute Res, Marysvale, Nr 71.8 38.2 53 36.5 51
untitled Gunnison Reservoir
20.3 11.3 56 12.8 63
untitled Sevier Bridge Reservoir, Juab, Nr
236.0 103.0 44 120.4 51
untitled Beaver
Minersville Res, Minersville, Nr 23.3 9.4 40 10.3 44
untitled
TOTAL 403.9 185.9 46 209.3 52

Monthly Streamflows


Precipitation Maps


Definitions

10% exceedance forecast: Given the current hydrometeorological conditions, i.e current snowpack, soil moisture and streamflow, the volume that has a 10% chance of being exceeded. Previously referred to as "Reasonable Maximum Forecast".

50% exceedance forecast: Given the current hydrometeorological conditions, i.e current snowpack, soil moisture and streamflow, the volume that has a 50% chance of being exceeded. Previously referred to as "Most Probable Forecast".

90% exceedance forecast: Given the current hydrometeorological conditions, i.e current snowpack, soil moisture and streamflow, the volume that has a 90% chance of being exceeded. Previously referred to as "Reasonable Minimum Forecast".

Acre-Foot (af): The volume equal to one acre covered one foot deep (43,560 cubic feet). See kaf below.

Average: The arithmetic mean. The sum of the values divided by the number of values. Values from 1971-2000 are used for this publication.

Categories: Much Above Average=Greater than 130%, Above Average=111-130%, Near Average=90-110%, Below Average=70-89%, Much Below Average=Less than 70%.

CBRFC: Colorado Basin River Forecast Center.

Forecast Period: The period from April 1 through July 31, unless otherwise noted.

kaf: Thousand Acre-Feet. See Acre-Foot above.

Inflow: The volume of water that flows into a reservoir or lake.

Median: The middle value of an ordered set of values. Half of the values are higher and half of the values are lower. When the set contains an even number of values the median is the average of the two middle numbers.

NOAA: National Oceanic and Atomospheric Administration.

NWS: National Weather Service.

Rounding Conventions:
RangeRound to
0-1.990.01
2.0-19.90.1
20-1991.0
200-9995.0
1000+3 significant digits


Streamflow: The volume of water that flows past a specific stream site.

Water Year: The 12-month period, October 1 through September 30. The water year is designated by the calendar year in which it ends. Thus, the year ending September 30, 2008, is called the "2008 water year."


Additional Information

Water supply forecasts take into consideration present hydrometeorological conditions and use average basin temperatures and precipitation for the forecast period. As the forecast season progresses, a greater portion of the future hydrologic and climatic uncertainty becomes known and monthly forecasts become more accurate. For more information on the tools we use, consult Water Supply Forecasting Tools.

Volume forecasts represent adjusted flows; that is, observed flows with upstream water use taken into account. Adjusted flows will closely approximate natural or unimpaired flows. However, not all upstream diversions or impoundments are measured or quantifiable. For specific adjustments used with each forecast point, consult the Guide to Water Supply Forecasting.

The Water Supply Outlook is issued monthly January through May by the Colorado Basin River Forecast Center. It represents a coordinated effort between the National Weather Service, Natural Resources Conservation Service, Bureau of Reclamation, U.S. Geological Survey and local water district managers.

Note: Data used in this report are provisional and are subject to revision.

For more information, or to be included on the mailing list, please contact:

Colorado Basin River Forecast Center
2242 W North Temple
Salt Lake City, UT 84116
(801) 524-5130
www.cbrfc.noaa.gov


Hydrologist: Brent Bernard