The following conditions influenced this month's forecasts:
Precipitation:
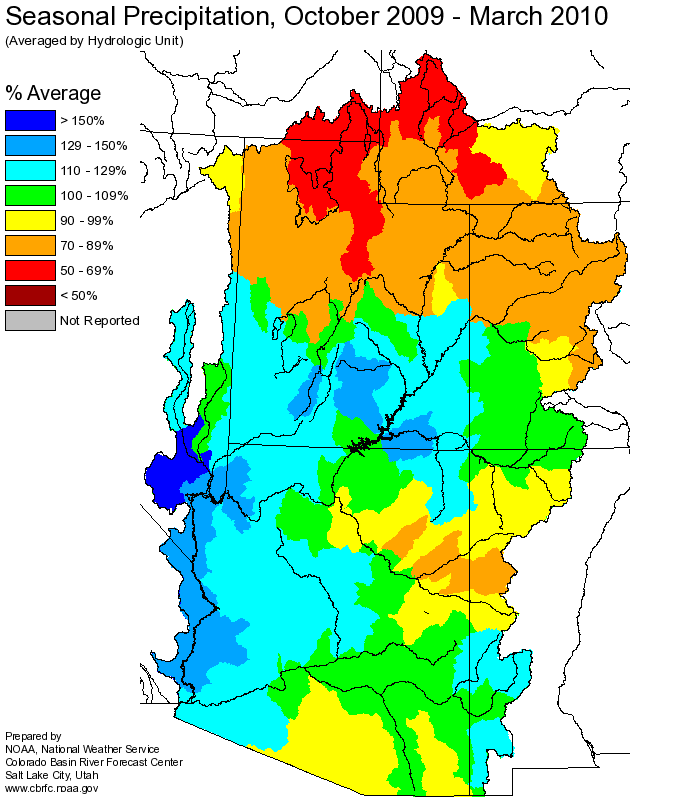
Seasonal October through March
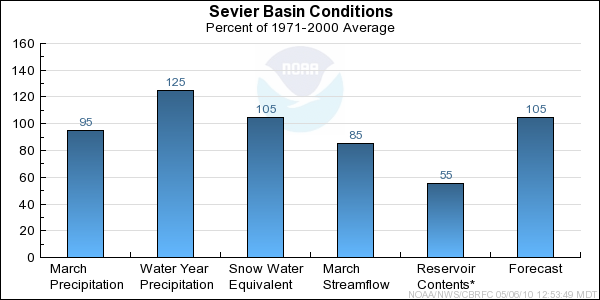
precipitation was 130 percent of average
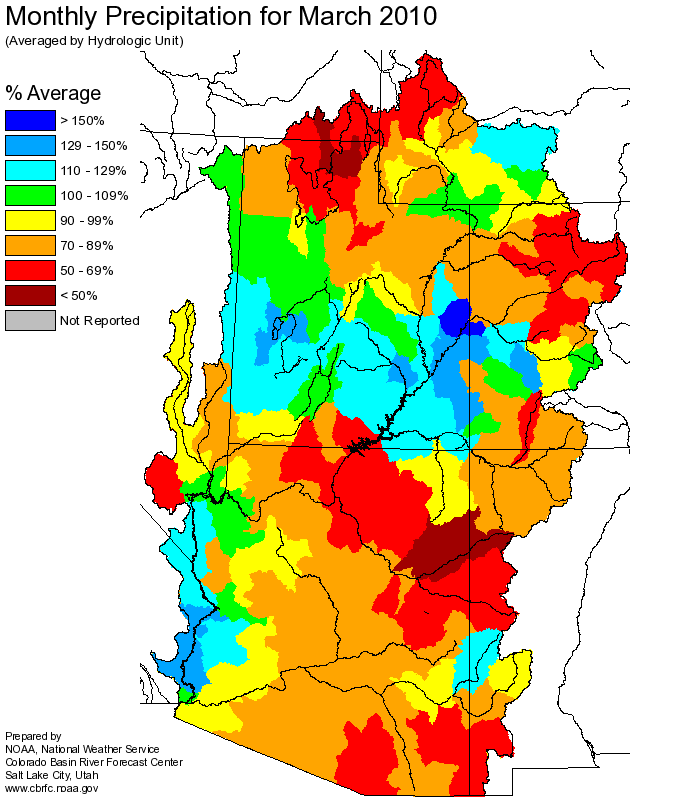
in the Sevier River Basin. March
precipitation was 105 percent of average.
Streamflow:
March streamflow estimates were 80 percent of average for the Sevier River at Hatch.
Snowpack:
April 1st snow water equivalent was 109 percent of average. In the headwaters, the indexed total was 141 percent of average.
In the lower basin, indexed snow along the Wasatch Plateau was 85 percent of average.
Upper Sevier River Basin
Snow Plot.
Sevier River Basin
Snow Plot.
Lower Sevier River Basin
Snow Plot.
Soil Moisture:
Modeled Soil
Moisture, states were below average heading into this winter and tend to lower seasonal volume forecasts.
Climate Forecasts:
El Nino climate conditions suggest increased chances for precipitation in this area.
The El Nino influence was not directly accounted for in the generation of these forecasts.
Forecast Summary:
The Sevier Basin seasonal precipitation remain above average. The headwaters however have much above average vs the more northern stations however
conditions overall improved last month.
Seasonal volume forecast
for the Sevier River Basin range between 55 and 152 percent of average. The median forecast this month increased by 15 percent to 105 percent of average.
Differences between the full period forecasts and the residual forecasts may not exactly equal the actual observed volumes due to rounding conventions (see Definitions section).