New 1981-2010 Averages being used this year.
Note: This publication is currently undergoing major revisions. The current publication will be replaced with a new publication based on stakeholder requirements and scientific advances. We expect to begin sharing details on this soon. If you have input on content, format, or publication frequency at any time, please contact us at cbrfc.webmasters@noaa.gov.Sevier Water Supply Outlook, April 1, 2012

Sevier Water Supply Outlook, April 1, 2012


Prepared by S. Bender
NOAA, National Weather Service
Colorado Basin River Forecast Center
Salt Lake City, Utah
www.cbrfc.noaa.gov

Contents

Sevier Summary


*Median of forecasts within each basin.


Sevier Basin Conditions

The following conditions influenced this month's forecasts:

Precipitation:
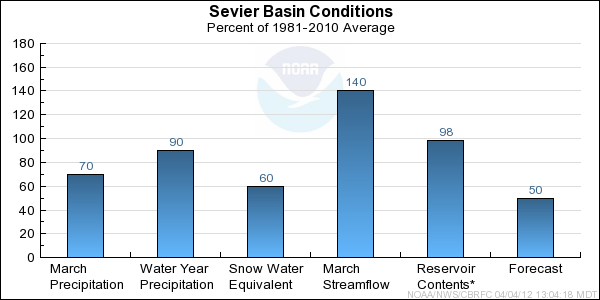
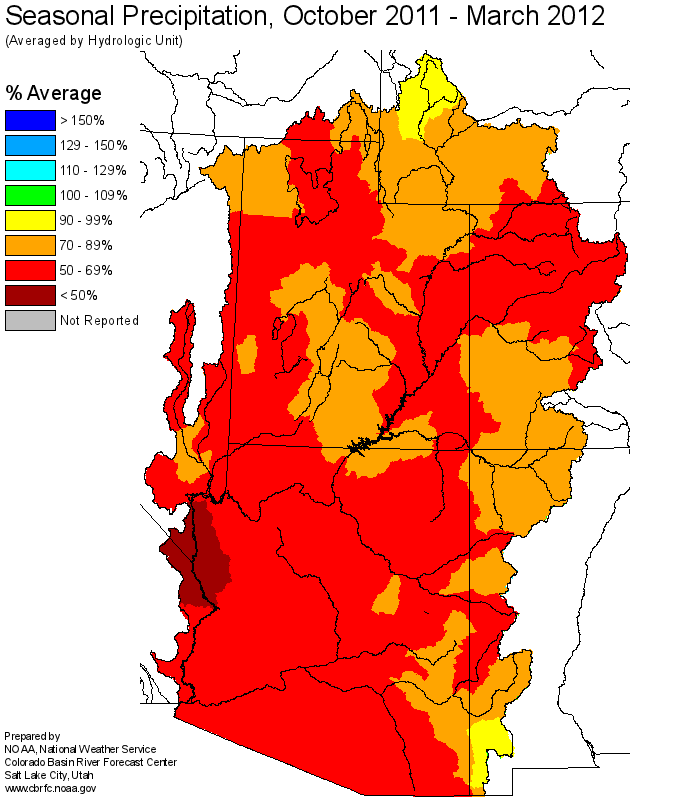
Seasonal October through March precipitation was 90 percent of average.
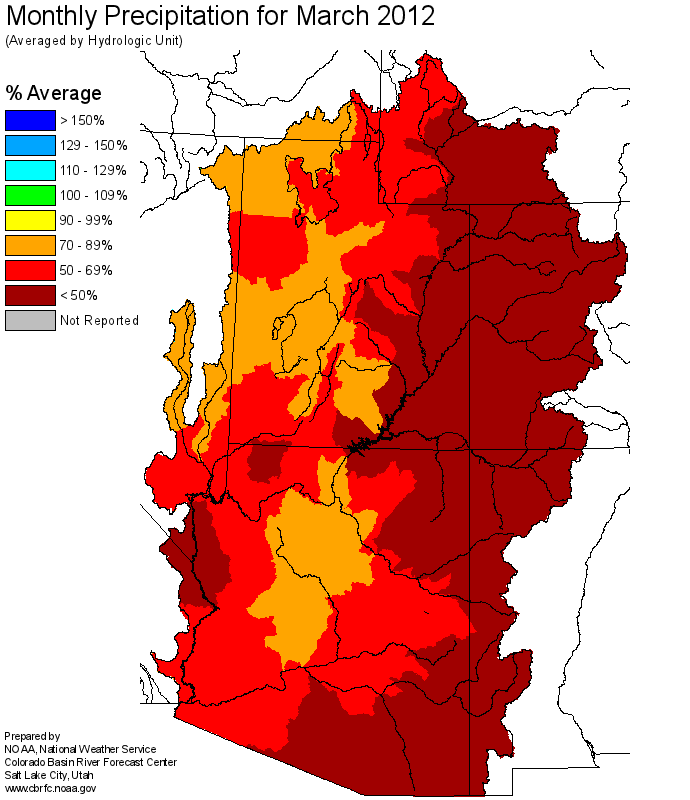
March precipitation was 70 percent of average in the Sevier River basin.

Streamflow:
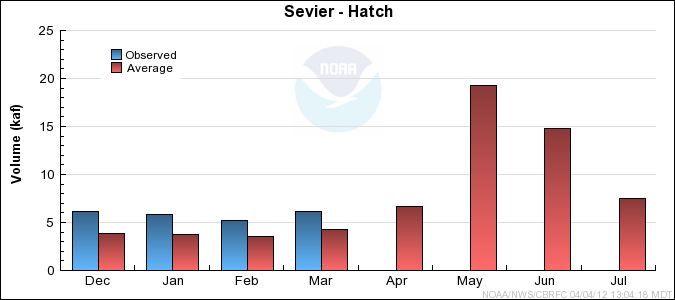
Streamflow for the Sevier River at Hatch was 140 percent of average for March.

Snowpack:
April 1st snow water equivalent was 60 percent of average for the overall Sevier River Basin. For the Sevier River headwaters, the April 1st snow water equivalent was 55 percent of average.

Sevier River Drainage Snow Plot.
Sevier River Basin Headwaters Snow Plot.
Lower Sevier River Basin Below Piute Snow Plot.

Soil Moisture:
Modeled soil moisture content was above average in the Sevier River headwater areas going into the winter.

Climate Forecasts:
Generally, climate scenarios like El Nino and La Nina do not strongly influence conditions in the Sevier River Basin. The southern part of the basin sees more of an influence from El Nino and La Nina than the northern part of the basin does. However, even in the southern part of the basin, the statistical correlations between climate indices like the Southern Oscillation Index and streamflow volumes are minor. As such, climate conditions are given only low weight, if any, in our water supply forecasts for the Sevier River basin.

Forecast Summary:
Due to a warm and dry March, snowpack conditions in the Sevier River Basin have deteriorated since March 1st. The snowpack is much below average. April 1st snow water equivalent was 60 percent of average for the overall Sevier River Basin, while it was slightly lower in the Sevier River headwaters at 55 percent of average. Higher than average baseflows continue to occur in the Sevier River basin.
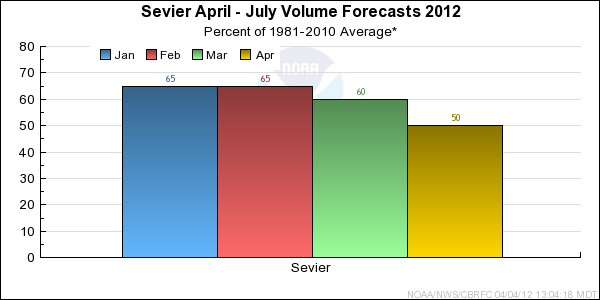
 Current April through July Seasonal volume forecasts range between 43 and 66 percent of average. The median April through July forecast volume is 50 percent of average.

The forecasts for the Sevier River at Hatch, the Sevier River near Kingston, the East Fork of the Sevier River, Piute Reservoir, and the Sevier River near Gunnison are 'Regulated or Observed' flow forecasts rather than 'Natural or Unregulated' forecasts, which are corrected for all upstream diversions.


* Percent usable capacity, not percent average contents.
Click for multi-month Graph.


Sevier Specific Site Forecasts (kaf)

Click site name for graph.
Forecast
Period
90%
Exceedance
Volume
50%
Exceedance
Volume
Percent
Average
10%
Exceedance
Volume
Sevier
Hatch *April-July14255233
Kingston, Nr *April-July10164827
Ef Sevier
Kingston, Nr *April-July12236628
Sevier
Piute Res, Marysville,nr *April-July24406152
Clear Ck
Sevier, Nr, Diversions, Abv April-July594313
Salina Ck
Emery, Nr April-July34.2536
Manti Ck
Manti, Nr, Dugway Ck, Blo April-July8106014
Sevier
Gunnison, Nr *April-July27474781
Beaver
Beaver, Nr April-July9145418
Coal Ck
Cedar City, Nr April-July694614

*Regulated Forecast, i.e. Observed flow uncorrected for upstream diversion.
Differences between the full period forecasts and the residual forecasts may not exactly equal the actual observed volumes due to rounding conventions (see Definitions section).

Sevier End of Month Reservoir Contents (kaf)

Usable
Capacity
EOM
Contents
Percent
Usable
Capacity
Last Year
EOM
Last Year
%Capacity
untitled Otter Ck
Otter Creek Res, Antimony, Nr 52.5 52.2 99 34.2 65
untitled Sevier
Piute Res, Marysville,nr 71.8 65.0 91 66.5 93
untitled Gunnison Reservoir
20.3 20.5 101 20.3 100
untitled Sevier Bridge Reservoir, Juab, Nr
236.0 234.1 99 140.5 60
untitled Beaver
Minersville Res, Minersville, Nr 23.3 25.2 108 14.4 62
untitled
TOTAL 403.9 397.0 98 275.9 68

Monthly Streamflows


Precipitation Maps


Definitions

10% exceedance forecast: Given the current hydrometeorological conditions, i.e current snowpack, soil moisture and streamflow, the volume that has a 10% chance of being exceeded. Previously referred to as "Reasonable Maximum Forecast".

50% exceedance forecast: Given the current hydrometeorological conditions, i.e current snowpack, soil moisture and streamflow, the volume that has a 50% chance of being exceeded. Previously referred to as "Most Probable Forecast".

90% exceedance forecast: Given the current hydrometeorological conditions, i.e current snowpack, soil moisture and streamflow, the volume that has a 90% chance of being exceeded. Previously referred to as "Reasonable Minimum Forecast".

Acre-Foot (af): The volume equal to one acre covered one foot deep (43,560 cubic feet). See kaf below.

Average: The arithmetic mean. The sum of the values divided by the number of values. Values from 1981-2010 are used for this publication.

Categories: Much Above Average=Greater than 130%, Above Average=111-130%, Near Average=90-110%, Below Average=70-89%, Much Below Average=Less than 70%.

CBRFC: Colorado Basin River Forecast Center.

Forecast Period: The period from April 1 through July 31, unless otherwise noted.

kaf: Thousand Acre-Feet. See Acre-Foot above.

Inflow: The volume of water that flows into a reservoir or lake.

Median: The middle value of an ordered set of values. Half of the values are higher and half of the values are lower. When the set contains an even number of values the median is the average of the two middle numbers.

NOAA: National Oceanic and Atomospheric Administration.

NWS: National Weather Service.

Rounding Conventions:
RangeRound to
0-1.990.01
2.0-19.90.1
20-1991.0
200-9995.0
1000+3 significant digits


Streamflow: The volume of water that flows past a specific stream site.

Water Year: The 12-month period, October 1 through September 30. The water year is designated by the calendar year in which it ends. Thus, the year ending September 30, 2008, is called the "2008 water year."


Additional Information

Water supply forecasts take into consideration present hydrometeorological conditions and use average basin temperatures and precipitation for the forecast period. As the forecast season progresses, a greater portion of the future hydrologic and climatic uncertainty becomes known and monthly forecasts become more accurate. For more information on the tools we use, consult Water Supply Forecasting Tools.

Volume forecasts represent adjusted flows; that is, observed flows with upstream water use taken into account. Adjusted flows will closely approximate natural or unimpaired flows. However, not all upstream diversions or impoundments are measured or quantifiable. For specific adjustments used with each forecast point, consult the Guide to Water Supply Forecasting.

The Water Supply Outlook is issued monthly January through May by the Colorado Basin River Forecast Center. It represents a coordinated effort between the National Weather Service, Natural Resources Conservation Service, Bureau of Reclamation, U.S. Geological Survey and local water district managers.

Note: Data used in this report are provisional and are subject to revision.

For more information, or to be included on the mailing list, please contact:

Colorado Basin River Forecast Center
2242 W North Temple
Salt Lake City, UT 84116
(801) 524-5130
www.cbrfc.noaa.gov


Hydrologist: S. Bender