Note: This publication is currently undergoing major revisions. The current publication will be replaced with a new publication based on stakeholder requirements and scientific advances. We expect to begin sharing details on this soon. If you have input on content, format, or publication frequency at any time, please contact us at cbrfc.webmasters@noaa.gov.Sevier Water Supply Outlook, June 1, 2009

Sevier Water Supply Outlook, June 1, 2009


Prepared by B.Bernard
NOAA, National Weather Service
Colorado Basin River Forecast Center
Salt Lake City, Utah
www.cbrfc.noaa.gov

Contents

Sevier Summary

-Snow Water Equivalent & Precipitation... 
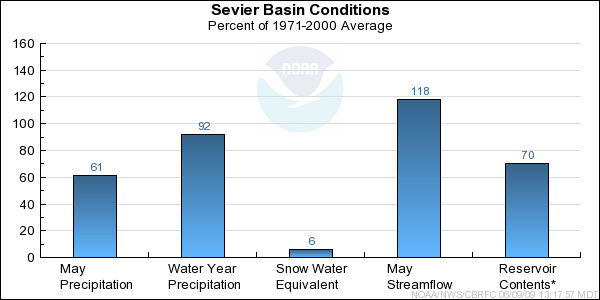
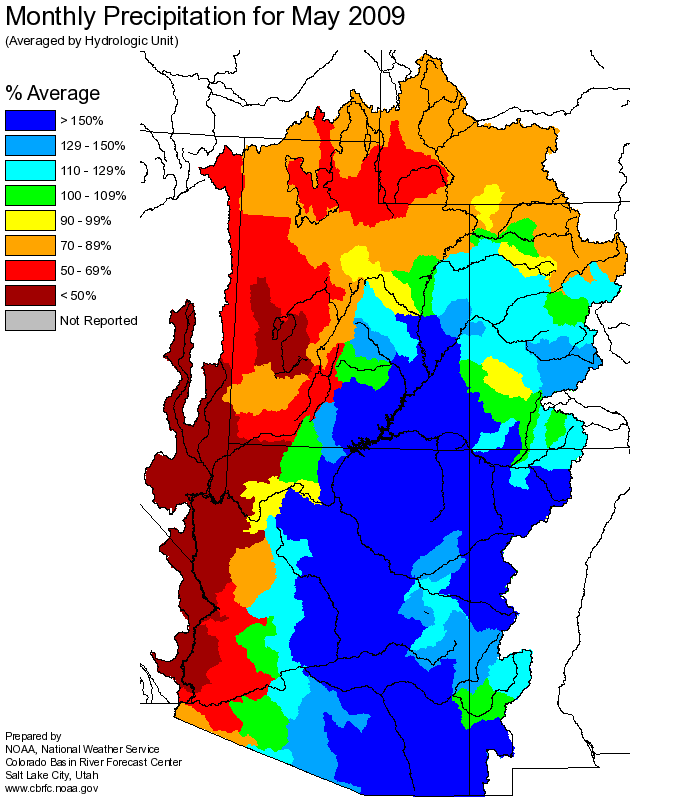
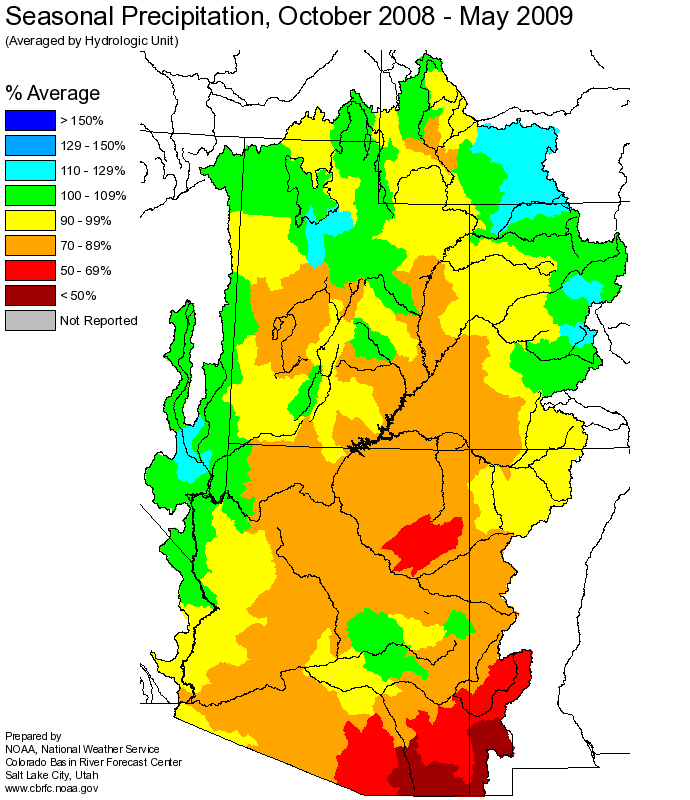
Monthly precipitation was below average at 61% and seasonal totals dropped to 92% of average. Snow water equivalents indexed for the basin as of June 8th are 6% of average. As of early June the snow pack is nearly gone with the only remnants remaining on northerly facing slopes above 10,000 ft. Snow graphs indicate that in some places the melt occurred 20-30 days earlier than normal.

-Soil Moisture & Streamflow... May streamflows for the Sevier River at Hatch were 118% of average. A forseable consequence of the early melt is that stream flow will now rapidly decline for the remainder of the April through July period. Streamflow models currently indicate that flows will likely be 40-80% of their normal monthly average for June and July.

-Short Term Weather Guidance...Weather guidance from National Weather Service Meteorological Models show above average precipitation and below average temperature conditions during the first 6-10 days of June. Meteorological models on June 8, indicate the Great Salt Lake Basin will remain under a moist southwest flow regime through June 17, 2009. Short term Climate Prediction Center guidance shows a slight shift to above average temperatures and below average precipitaiton conditions for the second half of June, 2009.

-General Discussions... Longer range predictions from NOAA's Climate Prediction Center are now suggesting a transition from ENSO-neutral conditions to El Nino conditions during June-August 2009. Please reference this CPC web link for further details and effects within the Sevier River Basin.

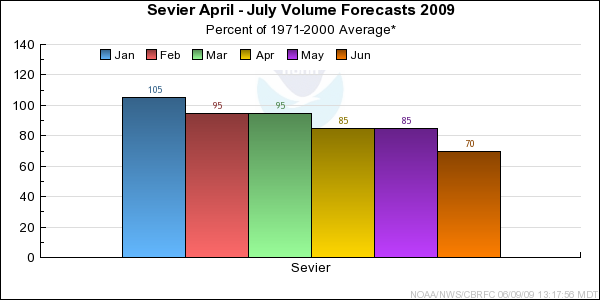
June through July volume forecast for the Sevier River ranged from 37% to 80% of average. The median forecast for the Sevier River Basin is 52% of average for the June, July period. April through July forecast were calculated using observed or estimated streamflows for April and May. The current April through July median forecast is now 70% of average.


*Median of forecasts within each basin.


Sevier Basin Conditions


* Percent usable capacity, not percent average contents.
Click for multi-month Graph.


Sevier Specific Site Forecasts (kaf)

Click site name for graph.
Forecast
Period
90%
Exceedance
Volume
50%
Exceedance
Volume
Percent
Average
10%
Exceedance
Volume
Sevier
Hatch April-July30448058
June-July12145218
Kingston, Nr April-July20247326
June-July78.5629
Ef Sevier
Kingston, Nr April-July18226324
June-July11158017
Sevier
Marysvale, Nr, Piute Dam, Blo April-July378189126
June-July19234528
Gunnison, Nr, San Pitch, Blo April-July207369193
June-July10193728
Chicken Ck
Levan, Nr April-July1.52442.6
June-July0.20.5401.2
Oak Ck
Oak City, Nr, Little Ck, Abv April-July0.51.4842.2
June-July0.10.26840.5
Beaver
Beaver, Nr April-July233011137
June-July12138815
Minersville Res, Minersville, Nr April-July14.52313932
June-July3.48.89417.3
Coal Ck
Cedar City, Nr April-July15178818
June-July3.74624.5

Differences between the full period forecasts and the residual forecasts may not exactly equal the actual observed volumes due to rounding conventions (see Definitions section).

Sevier Reservoir Contents (kaf)

Usable
Capacity
EOM
Contents
Percent
Usable
Capacity
Last Year
EOM
Last Year
%Capacity
untitled Otter Ck
Otter Creek Res, Antimony, Nr 52.5 32.4 62 38.0 72
untitled Sevier
Piute Res, Marysvale, Nr 71.8 43.6 61 44.0 61
untitled Gunnison Reservoir
20.3 20.4 100 15.0 74
untitled Sevier Bridge Reservoir, Juab, Nr
236.0 96.7 41 124.0 53
untitled Beaver
Minersville Res, Minersville, Nr 23.3 10.7 46 15.0 64
untitled
TOTAL 403.9 203.8 50 236.0 58

Precipitation Maps


Definitions

10% exceedance forecast: Given the current hydrometeorological conditions, i.e current snowpack, soil moisture and streamflow, the volume that has a 10% chance of being exceeded. Previously referred to as "Reasonable Maximum Forecast".

50% exceedance forecast: Given the current hydrometeorological conditions, i.e current snowpack, soil moisture and streamflow, the volume that has a 50% chance of being exceeded. Previously referred to as "Most Probable Forecast".

90% exceedance forecast: Given the current hydrometeorological conditions, i.e current snowpack, soil moisture and streamflow, the volume that has a 90% chance of being exceeded. Previously referred to as "Reasonable Minimum Forecast".

Acre-Foot (af): The volume equal to one acre covered one foot deep (43,560 cubic feet). See kaf below.

Average: The arithmetic mean. The sum of the values divided by the number of values. Values from 1971-2000 are used for this publication.

Categories: Much Above Average=Greater than 130%, Above Average=111-130%, Near Average=90-110%, Below Average=70-89%, Much Below Average=Less than 70%.

CBRFC: Colorado Basin River Forecast Center.

Forecast Period: The period from April 1 through July 31, unless otherwise noted.

kaf: Thousand Acre-Feet. See Acre-Foot above.

Inflow: The volume of water that flows into a reservoir or lake.

Median: The middle value of an ordered set of values. Half of the values are higher and half of the values are lower. When the set contains an even number of values the median is the average of the two middle numbers.

NOAA: National Oceanic and Atomospheric Administration.

NWS: National Weather Service.

Rounding Conventions:
RangeRound to
0-1.990.01
2.0-19.90.1
20-1991.0
200-9995.0
1000+3 significant digits


Streamflow: The volume of water that flows past a specific stream site.

Water Year: The 12-month period, October 1 through September 30. The water year is designated by the calendar year in which it ends. Thus, the year ending September 30, 2008, is called the "2008 water year."


Additional Information

Water supply forecasts take into consideration present hydrometeorological conditions and use average basin temperatures and precipitation for the forecast period. As the forecast season progresses, a greater portion of the future hydrologic and climatic uncertainty becomes known and monthly forecasts become more accurate. For more information on the tools we use, consult Water Supply Forecasting Tools.

Volume forecasts represent adjusted flows; that is, observed flows with upstream water use taken into account. Adjusted flows will closely approximate natural or unimpaired flows. However, not all upstream diversions or impoundments are measured or quantifiable. For specific adjustments used with each forecast point, consult the Guide to Water Supply Forecasting.

The Water Supply Outlook is issued monthly January through May by the Colorado Basin River Forecast Center. It represents a coordinated effort between the National Weather Service, Natural Resources Conservation Service, Bureau of Reclamation, U.S. Geological Survey and local water district managers.

Note: Data used in this report are provisional and are subject to revision.

For more information, or to be included on the mailing list, please contact:

Colorado Basin River Forecast Center
2242 W North Temple
Salt Lake City, UT 84116
(801) 524-5130
www.cbrfc.noaa.gov


Hydrologist: B.Bernard