Note: This publication is currently undergoing major revisions. The current publication will be replaced with a new publication based on stakeholder requirements and scientific advances. We expect to begin sharing details on this soon. If you have input on content, format, or publication frequency at any time, please contact us at cbrfc.webmasters@noaa.gov.Upper Colorado Water Supply Outlook, January 1, 2008

Upper Colorado Water Supply Outlook, January 1, 2008


Prepared by Brenda Alcorn, John Lhotak
NOAA, National Weather Service
Colorado Basin River Forecast Center
Salt Lake City, Utah
www.cbrfc.noaa.gov

Contents

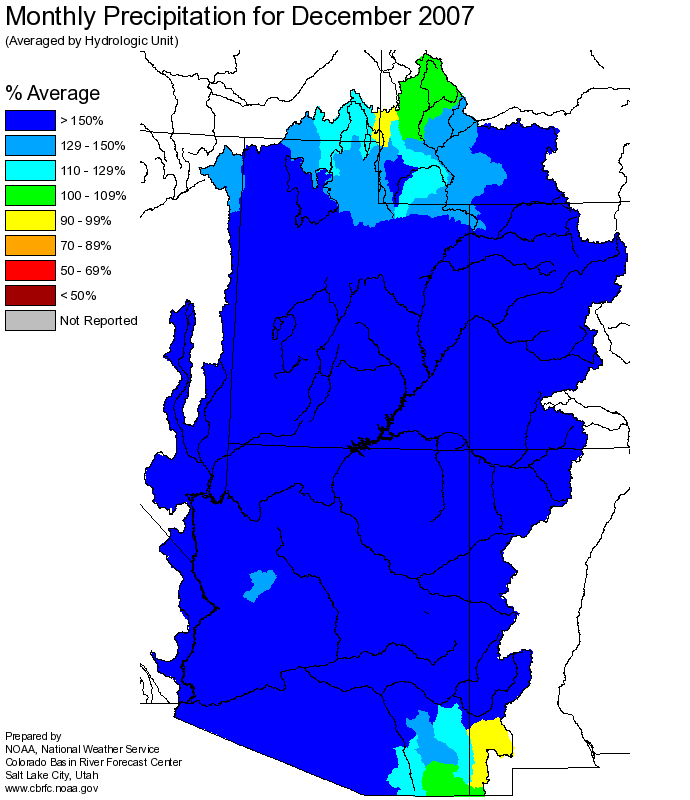
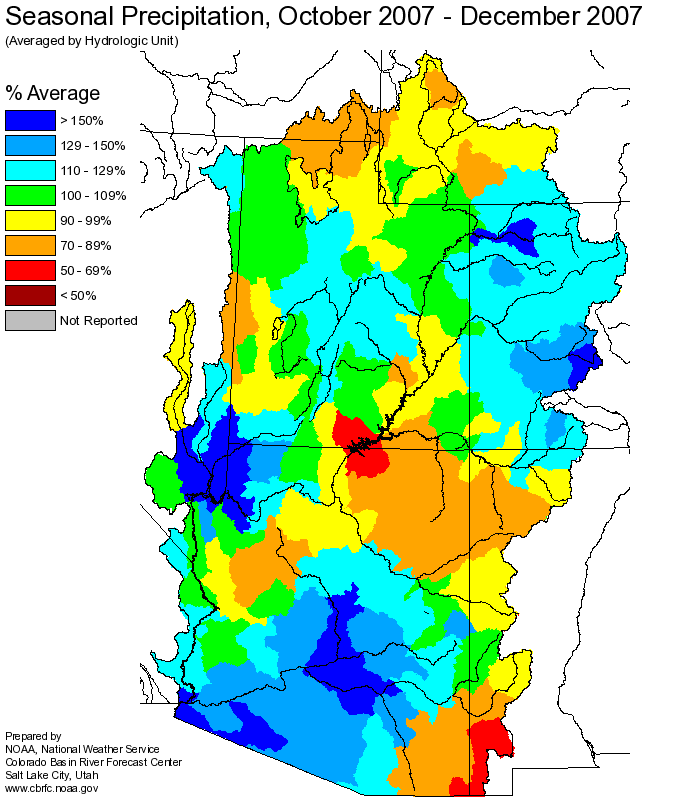
Upper Colorado Summary

December was exceptionally wet across the Upper Colorado Basin, especially in the Gunnison and Dolores basins where several individual precipitation stations received more than 300% of average for the month.


*Median of forecasts within each basin.


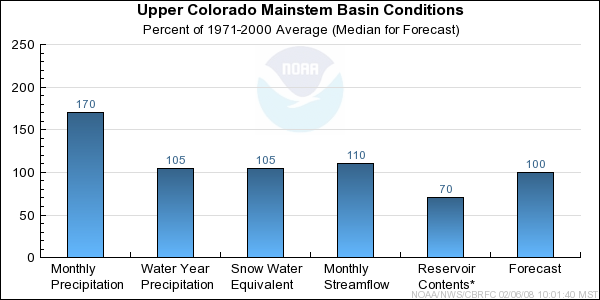
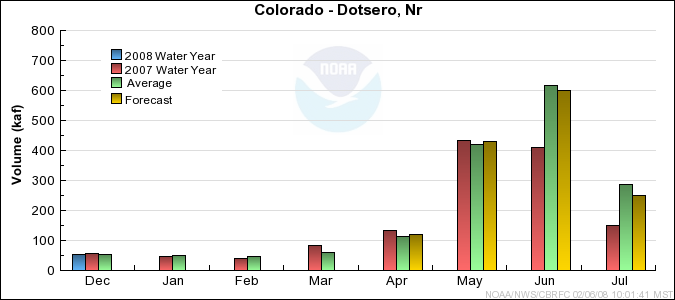
Upper Colorado Mainstem Basin Conditions

The 2008 water year started with above average precipitation for October, but then November was just 30% of average. December made up for that with 170% of average precipitation for the month, leaving both the seasonal precipitation and snow water equivalent near normal as of January 1. The April through July streamflow forecasts now range between 85% and 105% of average.


* Percent usable capacity, not percent average contents.
Click for multi-month Graph.

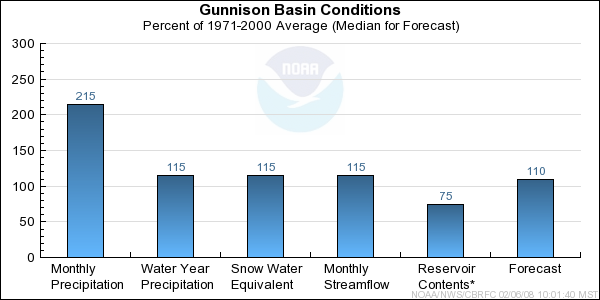
Gunnison Basin Conditions

Precipitation in the Gunnison Basin for October was 86% of average. It was then a dry November with the basin receiving 28% of the monthly average. However, in December the basin received 215% of the monthly average precipitation allowing the seasonal average precipitation for the beginning of January to climb back to 116%. Streamflow forecasts for April through July currently range between 105% and 120% of average.


* Percent usable capacity, not percent average contents.
Click for multi-month Graph.

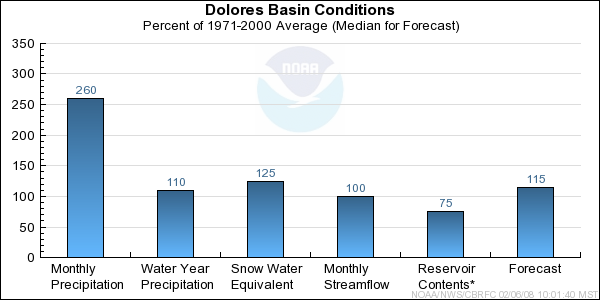
Dolores Basin Conditions

It was a slow beginning to the 2008 water year in the Dolores Basin. In October the basin saw 66% of the monthly average precipitation and in November just 29%. December more than made up for the light precipitation in October and November with the basin receiving 260% of the December monthly average. This has brought the basin back above average precipitation for the season to 112% of the seasonal average as of January 1. Streamflow forecasts for April through July currently range between 110% and 115% of average.


* Percent usable capacity, not percent average contents.
Click for multi-month Graph.


Upper Colorado Mainstem Specific Site Forecasts (kaf)

Click site name for graph.
Forecast
Period
50%
Exceedance
Percent
Average
10%
Exceedance
90%
Exceedance
Colorado
Lake Granby, Granby, Nr April-July21093275155
Willow Ck
Willow Ck Res, Granby, Nr April-July521027435
Fraser
Winter Park April-July19952513.5
Williams Fork
Williams Fork Res, Parshall, Nr April-July9510012172
Muddy Ck
Wolford Mtn Res, Blo April-July53887834
Blue
Dillon Res April-July170102230122
Green Mtn Res April-July290104390210
Colorado
Kremmling, Nr April-July855981120595
Eagle
Gypsum, Blo April-July31594445210
Colorado
Dotsero, Nr April-July1400971890980
Frying Pan
Ruedi Res, Basalt, Nr April-July150106210103
Roaring Fork
Glenwood Springs April-July7501061040520
Colorado
Glenwood Springs, Blo April-July216010028001520
Cameo, Nr April-July24009932501550
Plateau Ck
Cameo, Nr April-July11510021017.8
Colorado
Cisco, Nr April-July490010571302670
Mill Ck
Moab, Nr, Sheley Tun, At April-July51009.32.3
Colorado
Lake Powell, Glen Cyn Dam, At April-July8000101116004400


Gunnison Specific Site Forecasts (kaf)

Click site name for graph.
Forecast
Period
50%
Exceedance
Percent
Average
10%
Exceedance
90%
Exceedance
Taylor
Taylor Park Res April-July11010715473
Almont April-July170103230112
East
Almont April-July205107290134
Gunnison
Gunnison, Nr April-July415106605260
Tomichi Ck
Gunnison April-July9511716050
Lake Fork
Gateview April-July145115193104
Gunnison
Blue Mesa Res April-July7801081130510
Morrow Point Res April-July8501081160540
Crystal Res April-July9601051340580
Muddy Ck
Paonia Res, Bardine, Nr March-June11511518764
April-July11511319461
Nf Gunnison
Somerset, Nr April-July340111510215
Surface Ck
Cedaredge April-July191112911.4
Uncompahgre
Ridgway Res April-July11511316278
Colona April-July160115235103
Delta April-July14012022059
Gunnison
Grand Junction, Nr April-July170010923601050


Dolores Specific Site Forecasts (kaf)

Click site name for graph.
Forecast
Period
50%
Exceedance
Percent
Average
10%
Exceedance
90%
Exceedance
Dolores
Dolores April-July300113480172
Mcphee Res April-July360113595197
San Miguel
Placerville, Nr April-July14511021094
Dolores
Cisco, Nr April-July7001141080320

Differences between the full period forecasts and the residual forecasts may not exactly equal the actual observed volumes due to rounding conventions (see Definitions section).

Reservoir Monthly Inflow Forecasts


Upper Colorado Reservoir Contents (kaf)

Usable
Capacity
EOM
Contents
Percent
Usable
Capacity
Last Year
EOM
Last Year
%Capacity
untitled Colorado
Lake Granby, Granby, Nr 490.3 282.5 58 313.2 64
untitled Blue
Dillon Res 254.0 241.8 95 240.1 95
Green Mtn Res 146.9 88.3 60 96.5 66
untitled Taylor
Taylor Park Res 106.2 77.9 73 78.8 74
untitled Gunnison
Blue Mesa Res 829.5 580.6 70 587.4 71
untitled Uncompahgre
Ridgway Res 83.2 72.8 88 79.5 96
untitled Dolores
Mcphee Res 381.1 286.1 75 272.2 71
untitled
TOTAL 2291.1 1630.0 71 1667.6 73
Colorado
Lake Powell 24322.0 11245.8 46 12076.5 50

Monthly Streamflows


Precipitation Maps


Definitions

10% exceedance forecast: Given the current hydrometeorological conditions, i.e current snowpack, soil moisture and streamflow, the volume that has a 10% chance of being exceeded. Previously referred to as "Reasonable Maximum Forecast".

50% exceedance forecast: Given the current hydrometeorological conditions, i.e current snowpack, soil moisture and streamflow, the volume that has a 50% chance of being exceeded. Previously referred to as "Most Probable Forecast".

90% exceedance forecast: Given the current hydrometeorological conditions, i.e current snowpack, soil moisture and streamflow, the volume that has a 90% chance of being exceeded. Previously referred to as "Reasonable Minimum Forecast".

Acre-Foot (af): The volume equal to one acre covered one foot deep (43,560 cubic feet). See kaf below.

Average: The arithmetic mean. The sum of the values divided by the number of values. Values from 1971-2000 are used for this publication.

Categories: Much Above Average=Greater than 130%, Above Average=111-130%, Near Average=90-110%, Below Average=70-89%, Much Below Average=Less than 70%.

CBRFC: Colorado Basin River Forecast Center.

Forecast Period: The period from April 1 through July 31, unless otherwise noted.

kaf: Thousand Acre-Feet. See Acre-Foot above.

Inflow: The volume of water that flows into a reservoir or lake.

Median: The middle value of an ordered set of values. Half of the values are higher and half of the values are lower. When the set contains an even number of values the median is the average of the two middle numbers.

NOAA: National Oceanic and Atomospheric Administration.

NWS: National Weather Service.

Rounding Conventions:
RangeRound to
0-1.990.01
2.0-19.90.1
20-1991.0
200-9995.0
1000+3 significant digits


Streamflow: The volume of water that flows past a specific stream site.

Water Year: The 12-month period, October 1 through September 30. The water year is designated by the calendar year in which it ends. Thus, the year ending September 30, 2008, is called the "2008 water year."


Additional Information

Water supply forecasts take into consideration present hydrometeorological conditions and use average basin temperatures and precipitation for the forecast period. As the forecast season progresses, a greater portion of the future hydrologic and climatic uncertainty becomes known and monthly forecasts become more accurate. For more information on the tools we use, consult Water Supply Forecasting Tools.

Volume forecasts represent adjusted flows; that is, observed flows with upstream water use taken into account. Adjusted flows will closely approximate natural or unimpaired flows. However, not all upstream diversions or impoundments are measured or quantifiable. For specific adjustments used with each forecast point, consult the Guide to Water Supply Forecasting.

The Water Supply Outlook is issued monthly January through May by the Colorado Basin River Forecast Center. It represents a coordinated effort between the National Weather Service, Natural Resources Conservation Service, Bureau of Reclamation, U.S. Geological Survey and local water district managers.

Note: Data used in this report are provisional and are subject to revision.

For more information, or to be included on the mailing list, please contact:

Colorado Basin River Forecast Center
2242 W North Temple
Salt Lake City, UT 84116
(801) 524-5130
www.cbrfc.noaa.gov


Hydrologist: Brenda Alcorn, John Lhotak