
NOAA, National Weather Service
Colorado Basin River Forecast Center
Salt Lake City, Utah
www.cbrfc.noaa.gov
| Prepared by Brenda Alcorn, Tracy Cox NOAA, National Weather Service Colorado Basin River Forecast Center Salt Lake City, Utah www.cbrfc.noaa.gov |

| Forecast Period | 90% Exceedance Volume | 50% Exceedance Volume | Percent Average | 10% Exceedance Volume | |
| Colorado | |||||
| Lake Granby, Granby, Nr | April-July | 200 | 280 | 124 | 370 |
| Willow Ck | |||||
| Willow Ck Res, Granby, Nr | April-July | 44 | 70 | 137 | 102 |
| Fraser | |||||
| Winter Park | April-July | 15 | 23 | 115 | 29 |
| Williams Fork | |||||
| Williams Fork Res, Parshall, Nr | April-July | 76 | 110 | 116 | 150 |
| Muddy Ck | |||||
| Wolford Mtn Res, Blo | April-July | 46 | 76 | 127 | 114 |
| Blue | |||||
| Dillon Res | April-July | 134 | 200 | 120 | 280 |
| Green Mtn Res | April-July | 225 | 335 | 120 | 465 |
| Colorado | |||||
| Kremmling, Nr | April-July | 725 | 1070 | 123 | 1450 |
| Eagle | |||||
| Gypsum, Blo | April-July | 250 | 380 | 113 | 535 |
| Colorado | |||||
| Dotsero, Nr | April-July | 1140 | 1720 | 119 | 2410 |
| Frying Pan | |||||
| Ruedi Res, Basalt, Nr | April-July | 112 | 160 | 113 | 215 |
| Roaring Fork | |||||
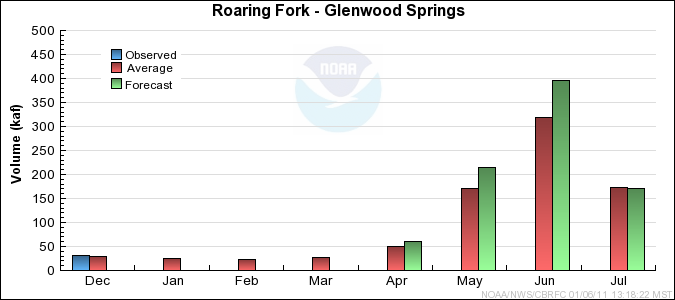
| Glenwood Springs | April-July | 570 | 840 | 118 | 1160 |
| Colorado | |||||
| Glenwood Springs, Blo | April-July | 1700 | 2560 | 119 | 3600 |
| Cameo, Nr | April-July | 1980 | 2910 | 120 | 4020 |
| Plateau Ck | |||||
| Cameo, Nr | April-July | 100 | 160 | 139 | 250 |
| Colorado | |||||
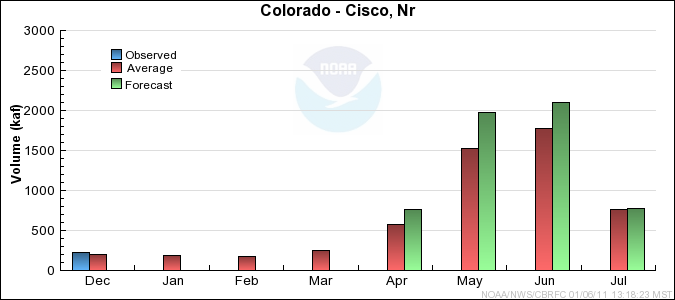
| Cisco, Nr | April-July | 3640 | 5620 | 121 | 8020 |
| Mill Ck | |||||
| Moab, Nr, Sheley Tun, At | April-July | 2.9 | 6 | 120 | 10.8 |
| Colorado | |||||
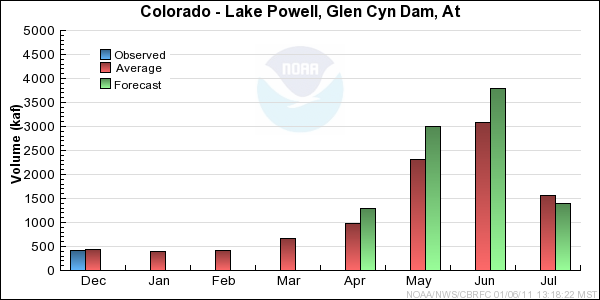
| Lake Powell, Glen Cyn Dam, At | April-July | 5860 | 9500 | 120 | 14000 |
| Forecast Period | 90% Exceedance Volume | 50% Exceedance Volume | Percent Average | 10% Exceedance Volume | |
| Taylor | |||||
| Taylor Park Res | April-July | 80 | 120 | 117 | 168 |
| Almont | April-July | 135 | 190 | 115 | 275 |
| East | |||||
| Almont | April-July | 154 | 230 | 120 | 320 |
| Gunnison | |||||
| Gunnison, Nr | April-July | 300 | 465 | 119 | 665 |
| Tomichi Ck | |||||
| Gunnison | April-July | 43 | 84 | 104 | 145 |
| Lake Fork | |||||
| Gateview | April-July | 91 | 130 | 103 | 176 |
| Gunnison | |||||
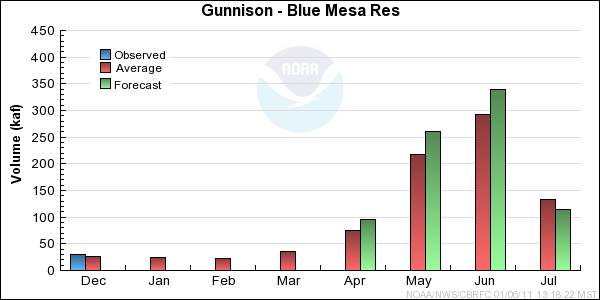
| Blue Mesa Res | April-July | 500 | 810 | 113 | 1200 |
| Morrow Point Res | April-July | 600 | 885 | 113 | 1300 |
| Crystal Res | April-July | 680 | 995 | 109 | 1440 |
| Muddy Ck | |||||
| Paonia Res, Bardine, Nr | March-June | 78 | 135 | 135 | 210 |
| April-July | 75 | 138 | 135 | 220 | |
| Nf Gunnison | |||||
| Somerset, Nr | April-July | 265 | 400 | 131 | 565 |
| Surface Ck | |||||
| Cedaredge | April-July | 15.8 | 25 | 146 | 37 |
| Uncompahgre | |||||
| Ridgway Res | April-July | 73 | 110 | 108 | 154 |
| Colona | April-July | 88 | 150 | 108 | 230 |
| Delta | April-July | 60 | 128 | 109 | 205 |
| Gunnison | |||||
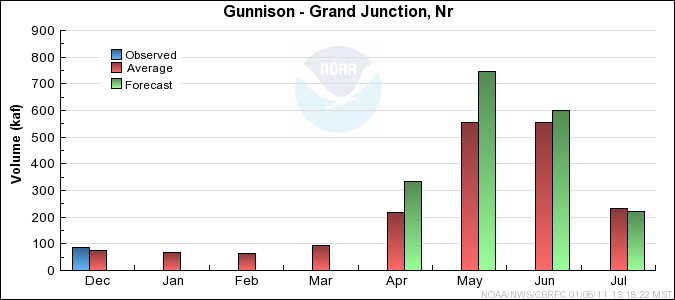
| Grand Junction, Nr | April-July | 1190 | 1900 | 122 | 2780 |
| Forecast Period | 90% Exceedance Volume | 50% Exceedance Volume | Percent Average | 10% Exceedance Volume | |
| Dolores | |||||
| Dolores | April-July | 158 | 280 | 106 | 450 |
| Mcphee Res | April-July | 200 | 350 | 109 | 540 |
| San Miguel | |||||
| Placerville, Nr | April-July | 90 | 140 | 106 | 205 |
| Dolores | |||||
| Cisco, Nr | April-July | 350 | 650 | 106 | 1100 |
| Range | Round to | |
| 0-1.99 | 0.01 | |
| 2.0-19.9 | 0.1 | |
| 20-199 | 1.0 | |
| 200-999 | 5.0 | |
| 1000+ | 3 significant digits |
