
NOAA, National Weather Service
Colorado Basin River Forecast Center
Salt Lake City, Utah
www.cbrfc.noaa.gov
| Prepared by Brenda Alcorn, Tracy Cox NOAA, National Weather Service Colorado Basin River Forecast Center Salt Lake City, Utah www.cbrfc.noaa.gov |
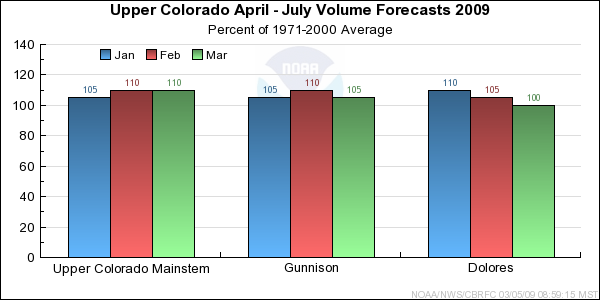
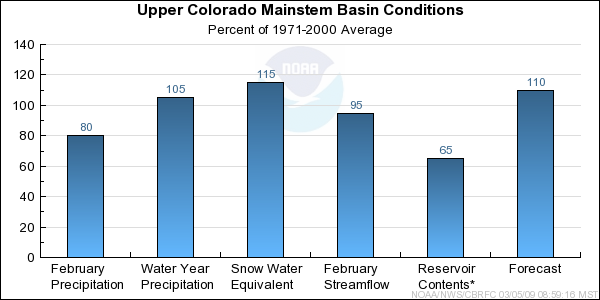
| Forecast Period | 90% Exceedance Volume | 50% Exceedance Volume | Percent Average | 10% Exceedance Volume | |
| Colorado | |||||
| Lake Granby, Granby, Nr | April-July | 182 | 235 | 104 | 295 |
| Willow Ck | |||||
| Willow Ck Res, Granby, Nr | April-July | 40 | 55 | 108 | 73 |
| Fraser | |||||
| Winter Park | April-July | 16.6 | 22 | 110 | 27 |
| Williams Fork | |||||
| Williams Fork Res, Parshall, Nr | April-July | 82 | 105 | 111 | 131 |
| Muddy Ck | |||||
| Wolford Mtn Res, Blo | April-July | 45 | 62 | 103 | 83 |
| Blue | |||||
| Dillon Res | April-July | 141 | 180 | 108 | 225 |
| Green Mtn Res | April-July | 240 | 310 | 111 | 395 |
| Colorado | |||||
| Kremmling, Nr | April-July | 660 | 940 | 108 | 1220 |
| Eagle | |||||
| Gypsum, Blo | April-July | 265 | 360 | 107 | 475 |
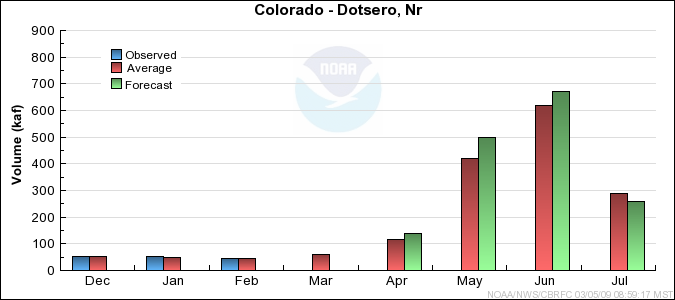
| Colorado | |||||
| Dotsero, Nr | April-July | 1200 | 1570 | 109 | 1990 |
| Frying Pan | |||||
| Ruedi Res, Basalt, Nr | April-July | 115 | 155 | 110 | 205 |
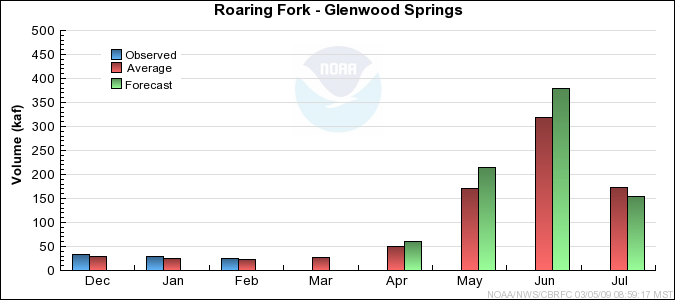
| Roaring Fork | |||||
| Glenwood Springs | April-July | 620 | 810 | 114 | 1030 |
| Colorado | |||||
| Glenwood Springs, Blo | April-July | 1800 | 2400 | 111 | 3000 |
| Cameo, Nr | April-July | 1970 | 2700 | 112 | 3430 |
| Plateau Ck | |||||
| Cameo, Nr | April-July | 65 | 115 | 100 | 170 |
| Colorado | |||||
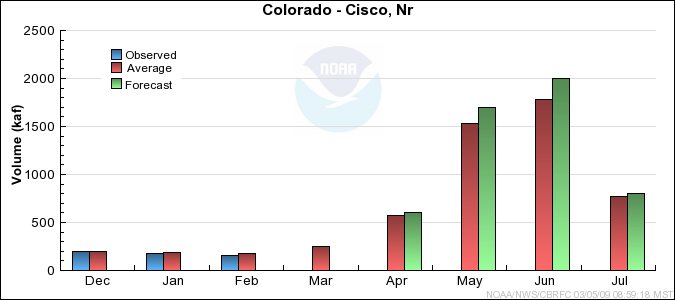
| Cisco, Nr | April-July | 3320 | 5100 | 110 | 6880 |
| Mill Ck | |||||
| Moab, Nr, Sheley Tun, At | April-July | 3 | 4.8 | 96 | 7.3 |
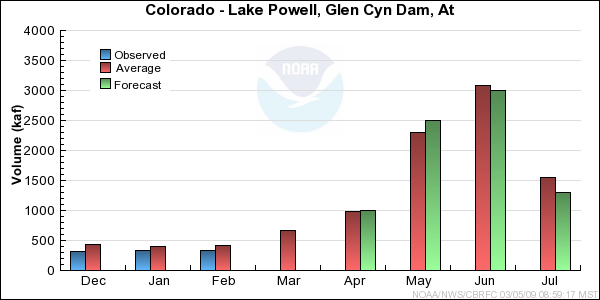
| Colorado | |||||
| Lake Powell, Glen Cyn Dam, At | April-July | 4630 | 7800 | 98 | 11000 |
| Forecast Period | 90% Exceedance Volume | 50% Exceedance Volume | Percent Average | 10% Exceedance Volume | |
| Taylor | |||||
| Taylor Park Res | April-July | 78 | 105 | 102 | 136 |
| Almont | April-July | 123 | 168 | 102 | 215 |
| East | |||||
| Almont | April-July | 157 | 205 | 107 | 260 |
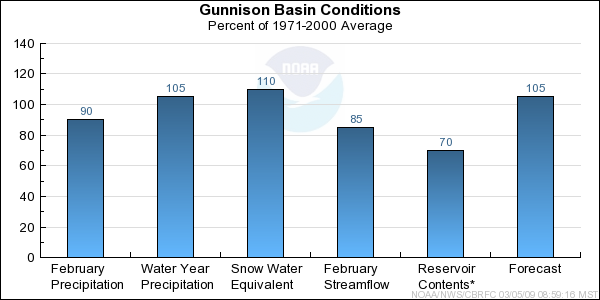
| Gunnison | |||||
| Gunnison, Nr | April-July | 305 | 415 | 106 | 540 |
| Tomichi Ck | |||||
| Gunnison | April-July | 38 | 75 | 93 | 130 |
| Lake Fork | |||||
| Gateview | April-July | 88 | 120 | 95 | 157 |
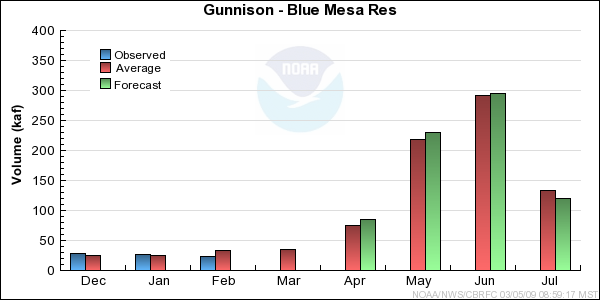
| Gunnison | |||||
| Blue Mesa Res | April-July | 520 | 730 | 101 | 990 |
| Morrow Point Res | April-July | 555 | 800 | 102 | 1040 |
| Crystal Res | April-July | 585 | 900 | 98 | 1210 |
| Muddy Ck | |||||
| Paonia Res, Bardine, Nr | March-June | 68 | 110 | 110 | 166 |
| April-July | 67 | 112 | 110 | 174 | |
| Nf Gunnison | |||||
| Somerset, Nr | April-July | 245 | 340 | 111 | 460 |
| Surface Ck | |||||
| Cedaredge | April-July | 11.6 | 17 | 99 | 24 |
| Uncompahgre | |||||
| Ridgway Res | April-July | 77 | 110 | 108 | 151 |
| Colona | April-July | 92 | 145 | 104 | 215 |
| Delta | April-July | 51 | 130 | 111 | 210 |
| Gunnison | |||||
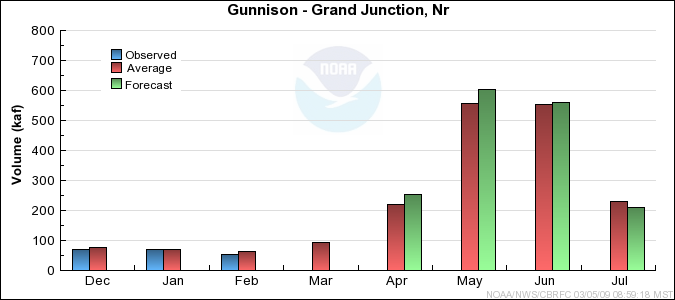
| Grand Junction, Nr | April-July | 1090 | 1630 | 104 | 2170 |
| Forecast Period | 90% Exceedance Volume | 50% Exceedance Volume | Percent Average | 10% Exceedance Volume | |
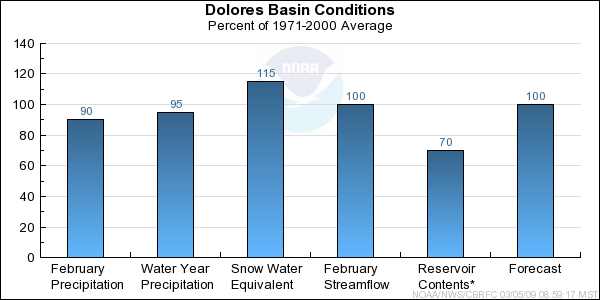
| Dolores | |||||
| Dolores | April-July | 182 | 270 | 102 | 380 |
| Mcphee Res | April-July | 215 | 330 | 103 | 480 |
| San Miguel | |||||
| Placerville, Nr | April-July | 97 | 140 | 106 | 193 |
| Dolores | |||||
| Cisco, Nr | April-July | 330 | 620 | 101 | 910 |
| Range | Round to | |
| 0-1.99 | 0.01 | |
| 2.0-19.9 | 0.1 | |
| 20-199 | 1.0 | |
| 200-999 | 5.0 | |
| 1000+ | 3 significant digits |