Note: This publication is currently undergoing major revisions. The current publication will be replaced with a new publication based on stakeholder requirements and scientific advances. We expect to begin sharing details on this soon. If you have input on content, format, or publication frequency at any time, please contact us at cbrfc.webmasters@noaa.gov.Upper Colorado Water Supply Outlook, April 1, 2011Upper Colorado Water Supply Outlook, April 1, 2011
Contents
Upper Colorado Summary
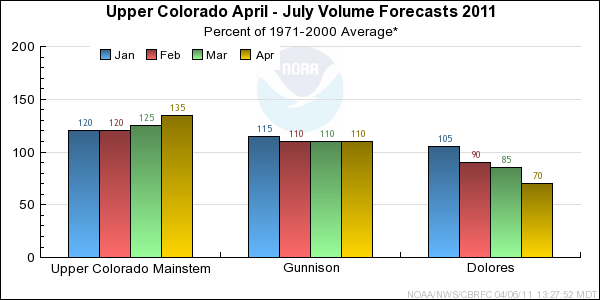
*Median of forecasts within each basin.
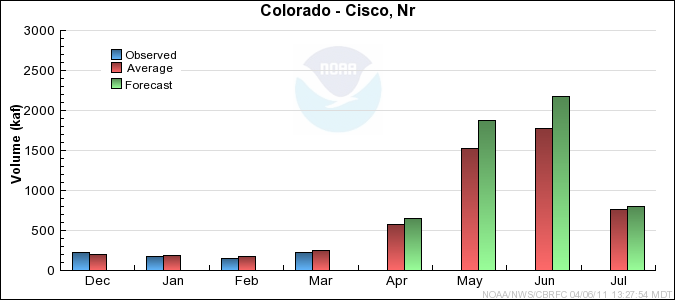
Upper Colorado Mainstem Basin Conditions
The following conditions influenced this month's forecasts:
Precipitation:
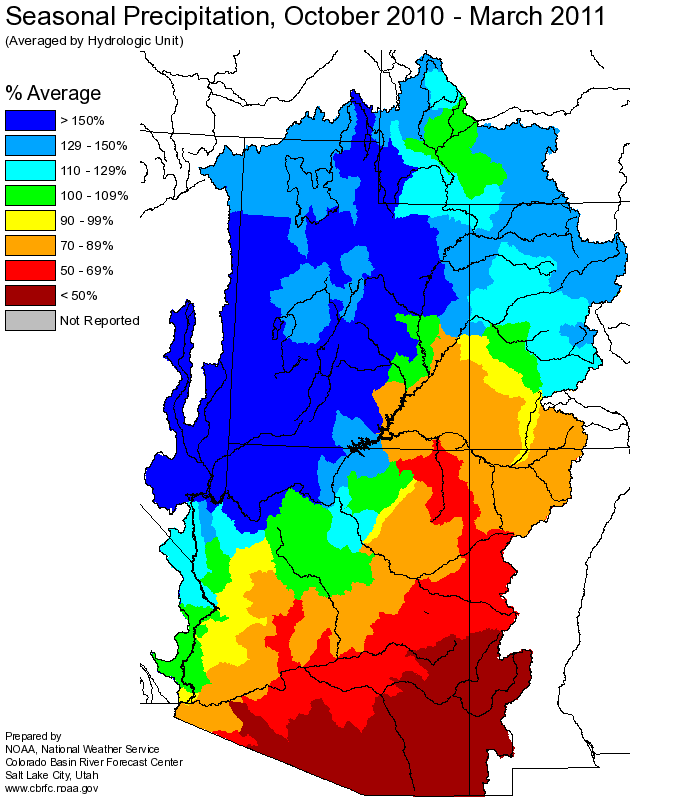
Seasonal October through March
precipitation
remains much above average in the Upper Colorado mainstem basin at 130 percent of average.
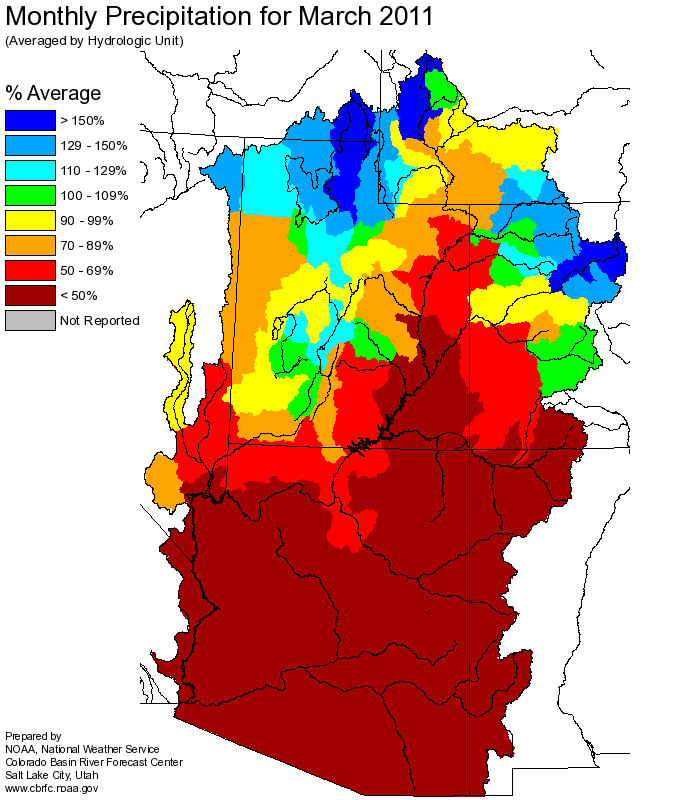
March
precipitation was near 125 percent of
average in the basin as a whole. However, the uppermost headwaters of the basin
received near 150% of average precipitation for the month.
Snow:
April 1st snow water equivalent was near 130 percent of average in the basin
as a whole. This is significant for this time of year as it is also near 130%
of the average seasonal peak. Many snotel sites in the upper portion of the
basin have snow water equivalent values in the top 5% of their historical records,
with a few at record levels.
--- Upper Colorado basin
snow
water equivalent plot
Streamflow:
March streamflow was near 100 percent of average.
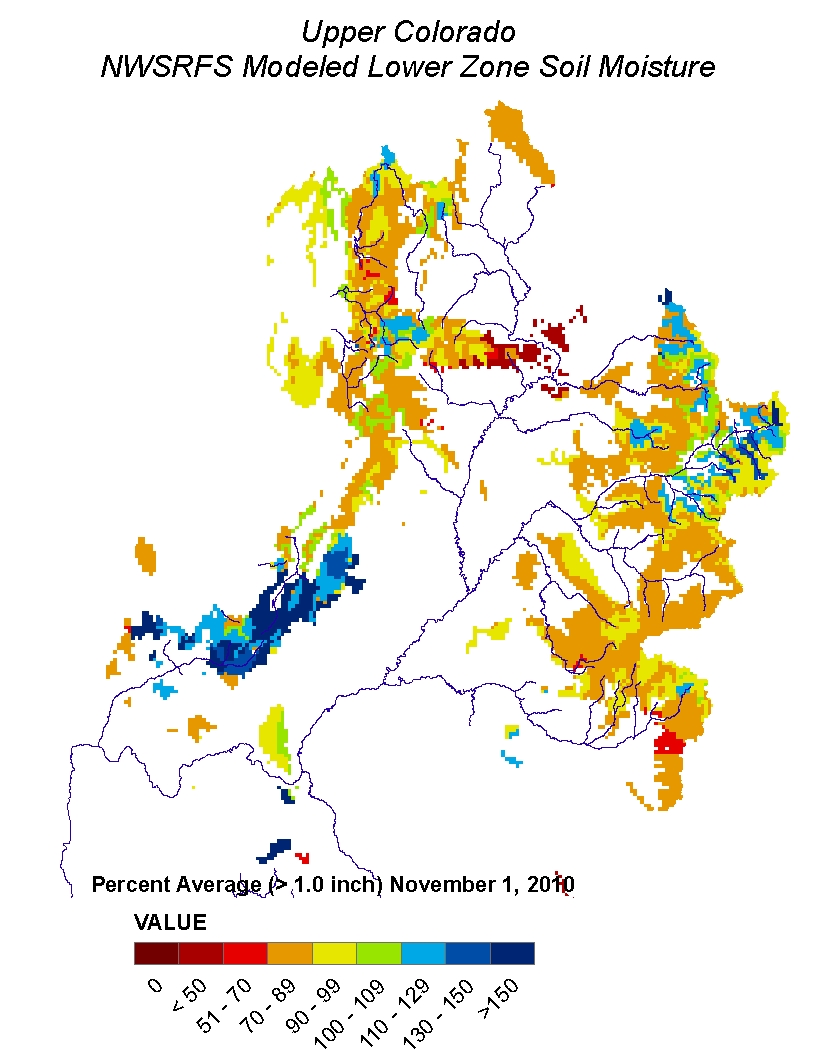
Soil Moisture:
Modeled
soil
moisture states were near to above average heading into the winter.
Climate Forecasts:
Climate forecasts were not a factor because there is not a strong correlation
between La Nina conditions and winter precipitation in the Upper Colorado mainstem basin.
Forecast Summary:
Almost all forecast volumes were raised from last month due to yet another
month of above average precipitation combined with the much above average snow water
equivalent at this point in the season. Current April through July streamflow volume
forecasts range between 120 and 150 percent of average with a median
value of 135 percent.
Many of these forecast volumes are in the top five of historical
volumes observed since 1970.
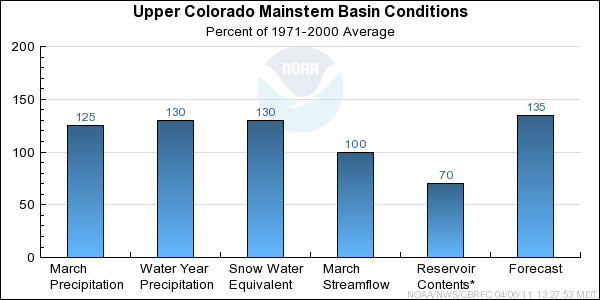
* Percent usable capacity, not percent average contents.
Click for multi-month Graph.
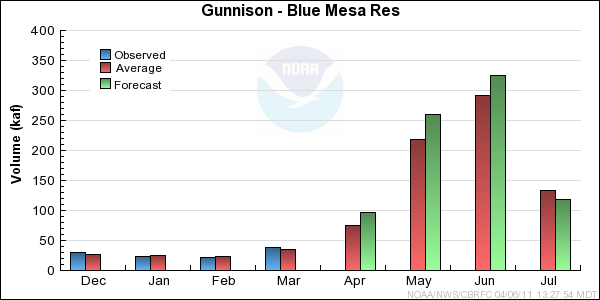
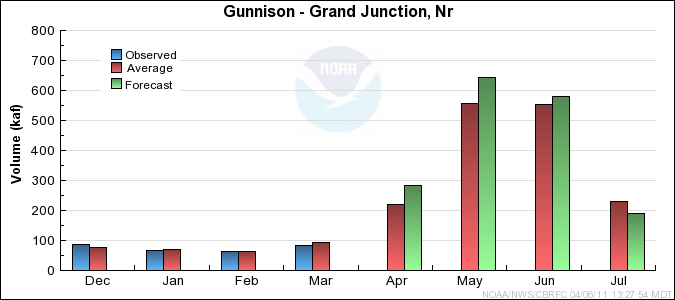
Gunnison Basin Conditions
The following conditions influenced this month's forecasts:
Precipitation:
Seasonal October through March
precipitation was 115 percent of average
in the Gunnison basin. March
precipitation was 90 percent of average.
Snow:
April 1st snow water equivalent was near 115 percent of average in the Gunnison basin; this is around 110% of the seasonal peak.
--- Gunnison basin
snow
water equivalent plot
Streamflow:
March streamflow was 90 percent of average.
Soil Moisture:
Modeled
soil
moisture states were below to near average heading into the winter.
Climate Forecasts:
Climate forecasts were not a factor because there is not a strong correlation
between La Nina conditions and winter precipitation in the Gunnison basin.
Forecast Summary:
March precipitation throughout the Gunnison basin was average at 90%. Seasonal precipitation for the Gunnison basin dropped a little from last month to 115% of average.
April 1st seasonal snow water equivalent for the Gunnison was above average with 115%; whereas the snow water equivalent is 110% of the average seasonal peak.
Since there was a slight increases in the seasonal snow water equivalent in the northern portions of the Gunnison basin, the current April through July streamflow
volume forecasts remained the same from last month's forecast. Current April through July streamflow volume
forecasts range
between 83 and 133 percent of average with a median value of 110 percent.
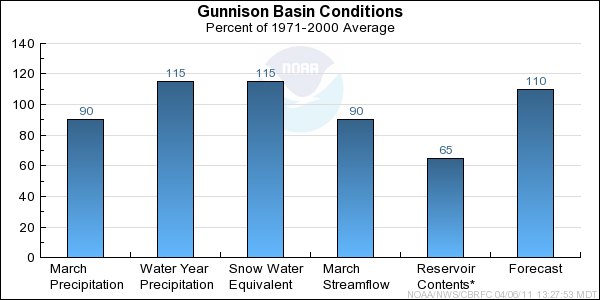
* Percent usable capacity, not percent average contents.
Click for multi-month Graph.
Dolores Basin Conditions
The following conditions influenced this month's forecasts:
Precipitation:
Seasonal October through March
precipitation was 95 percent of average
in the entire Dolores basin. March
precipitation was just 60 percent of average.
Snow:
April 1st snow water equivalent was 85 percent of average in the Dolores basin as a whole; this is about 75% of the seasonal peak.
--- Dolores basin
snow
water equivalent plot
Streamflow:
March streamflow was 60 percent of average.
Soil Moisture:
Modeled
soil
moisture states were average to slightly below average heading into the winter.
Climate Forecasts:
The correlation of La Nina and April through July water volumes in the Dolores basin is small that
it did not influence the forecast process.
Forecast Summary:
March precipitation throughout the Dolores basin was much below average at 60%. Seasonal precipitation for the Dolores basin dropped from last month to 95% of average.
April 1st seasonal snow water equivalent for the Dolores was average with 85%; whereas the snow water equivalent is 75% of the average seasonal peak.
Since the percent of average for both seasonal snow water equivalent and seasonal precipitation decreased from last month, the current April through July streamflow volume forecasts
dropped in the Dolores Basin from last month's forecast. Current April through July streamflow volume
forecasts range between
68 and 71 percent of average, with a median value of 70 percent.
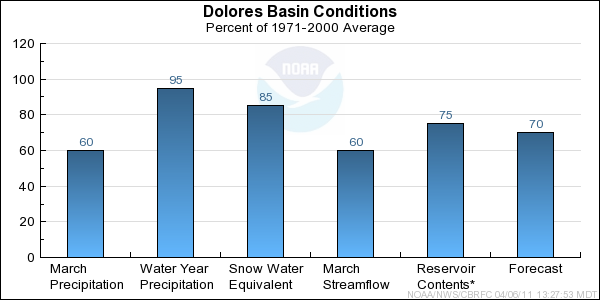
* Percent usable capacity, not percent average contents.
Click for multi-month Graph.
Differences between the full period forecasts and the residual forecasts may not exactly equal the actual observed volumes due to rounding conventions (see Definitions section).
Reservoir Monthly Inflow Forecasts
Monthly Streamflows
Precipitation Maps
Hydrologist: Brenda Alcorn, Tracy Cox
