Note: This publication is currently undergoing major revisions. The current publication will be replaced with a new publication based on stakeholder requirements and scientific advances. We expect to begin sharing details on this soon. If you have input on content, format, or publication frequency at any time, please contact us at cbrfc.webmasters@noaa.gov.Upper Colorado Water Supply Outlook, May 1, 2009Upper Colorado Water Supply Outlook, May 1, 2009
Contents
Upper Colorado Summary
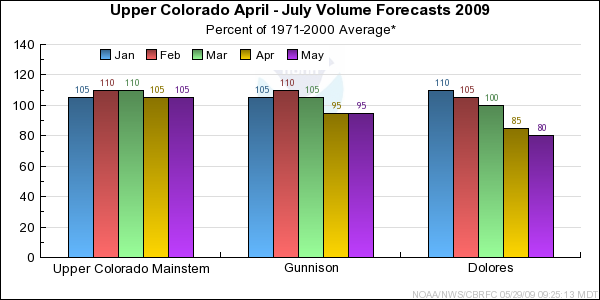
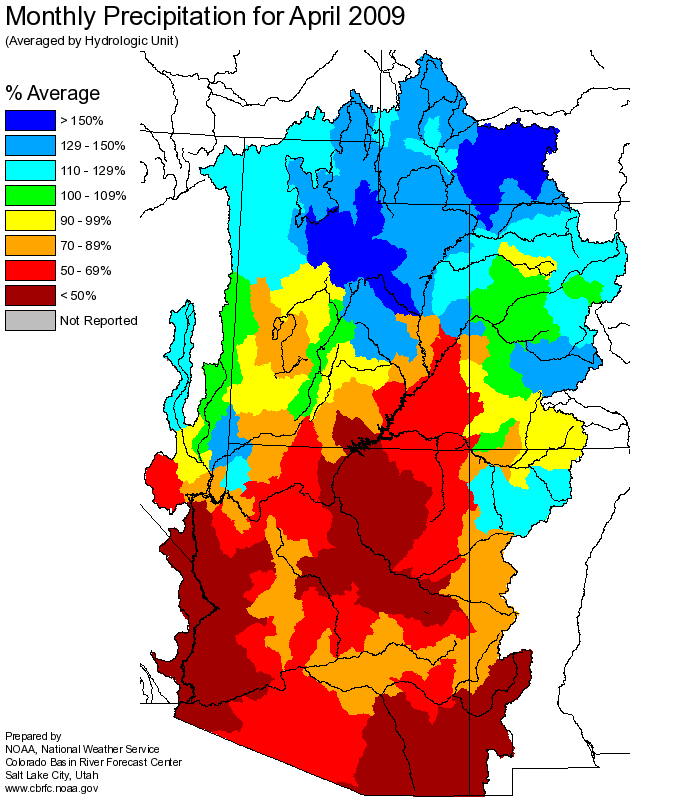
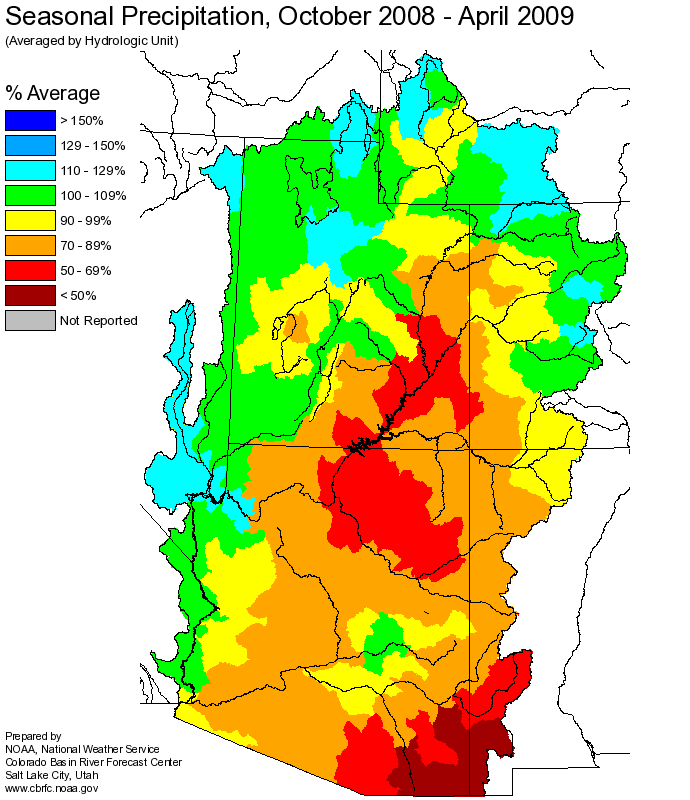
April precipitation was above average in the Upper Colorado and Gunnison Basins and near average in the Dolores basin. Snow water equivalent values peaked in the Upper Colorado and Gunnison Basins in the latter part of April with the Upper Colorado reaching 115% of the seasonal average peak and the Gunnison 110%. The Dolores Basin snow water equivalent peaked at the beginning of April at just under 100% of the seasonal average peak. May 1st snow water equivalent values were down quite a bit from their peaks with the Upper Colorado still near average at 95% of average, but the Gunnison and Dolores basins were both below average for this time of year at 80% and 50% of average respectively. Overall, the May 1st April through July forecast runoff volumes are similar to the April 1st forecasts in the Upper Colorado and Gunnison Basins and dropped slightly in the Dolores Basin.
*Median of forecasts within each basin.
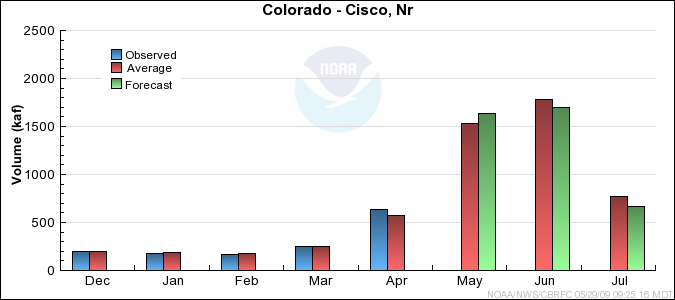
Upper Colorado Mainstem Basin Conditions
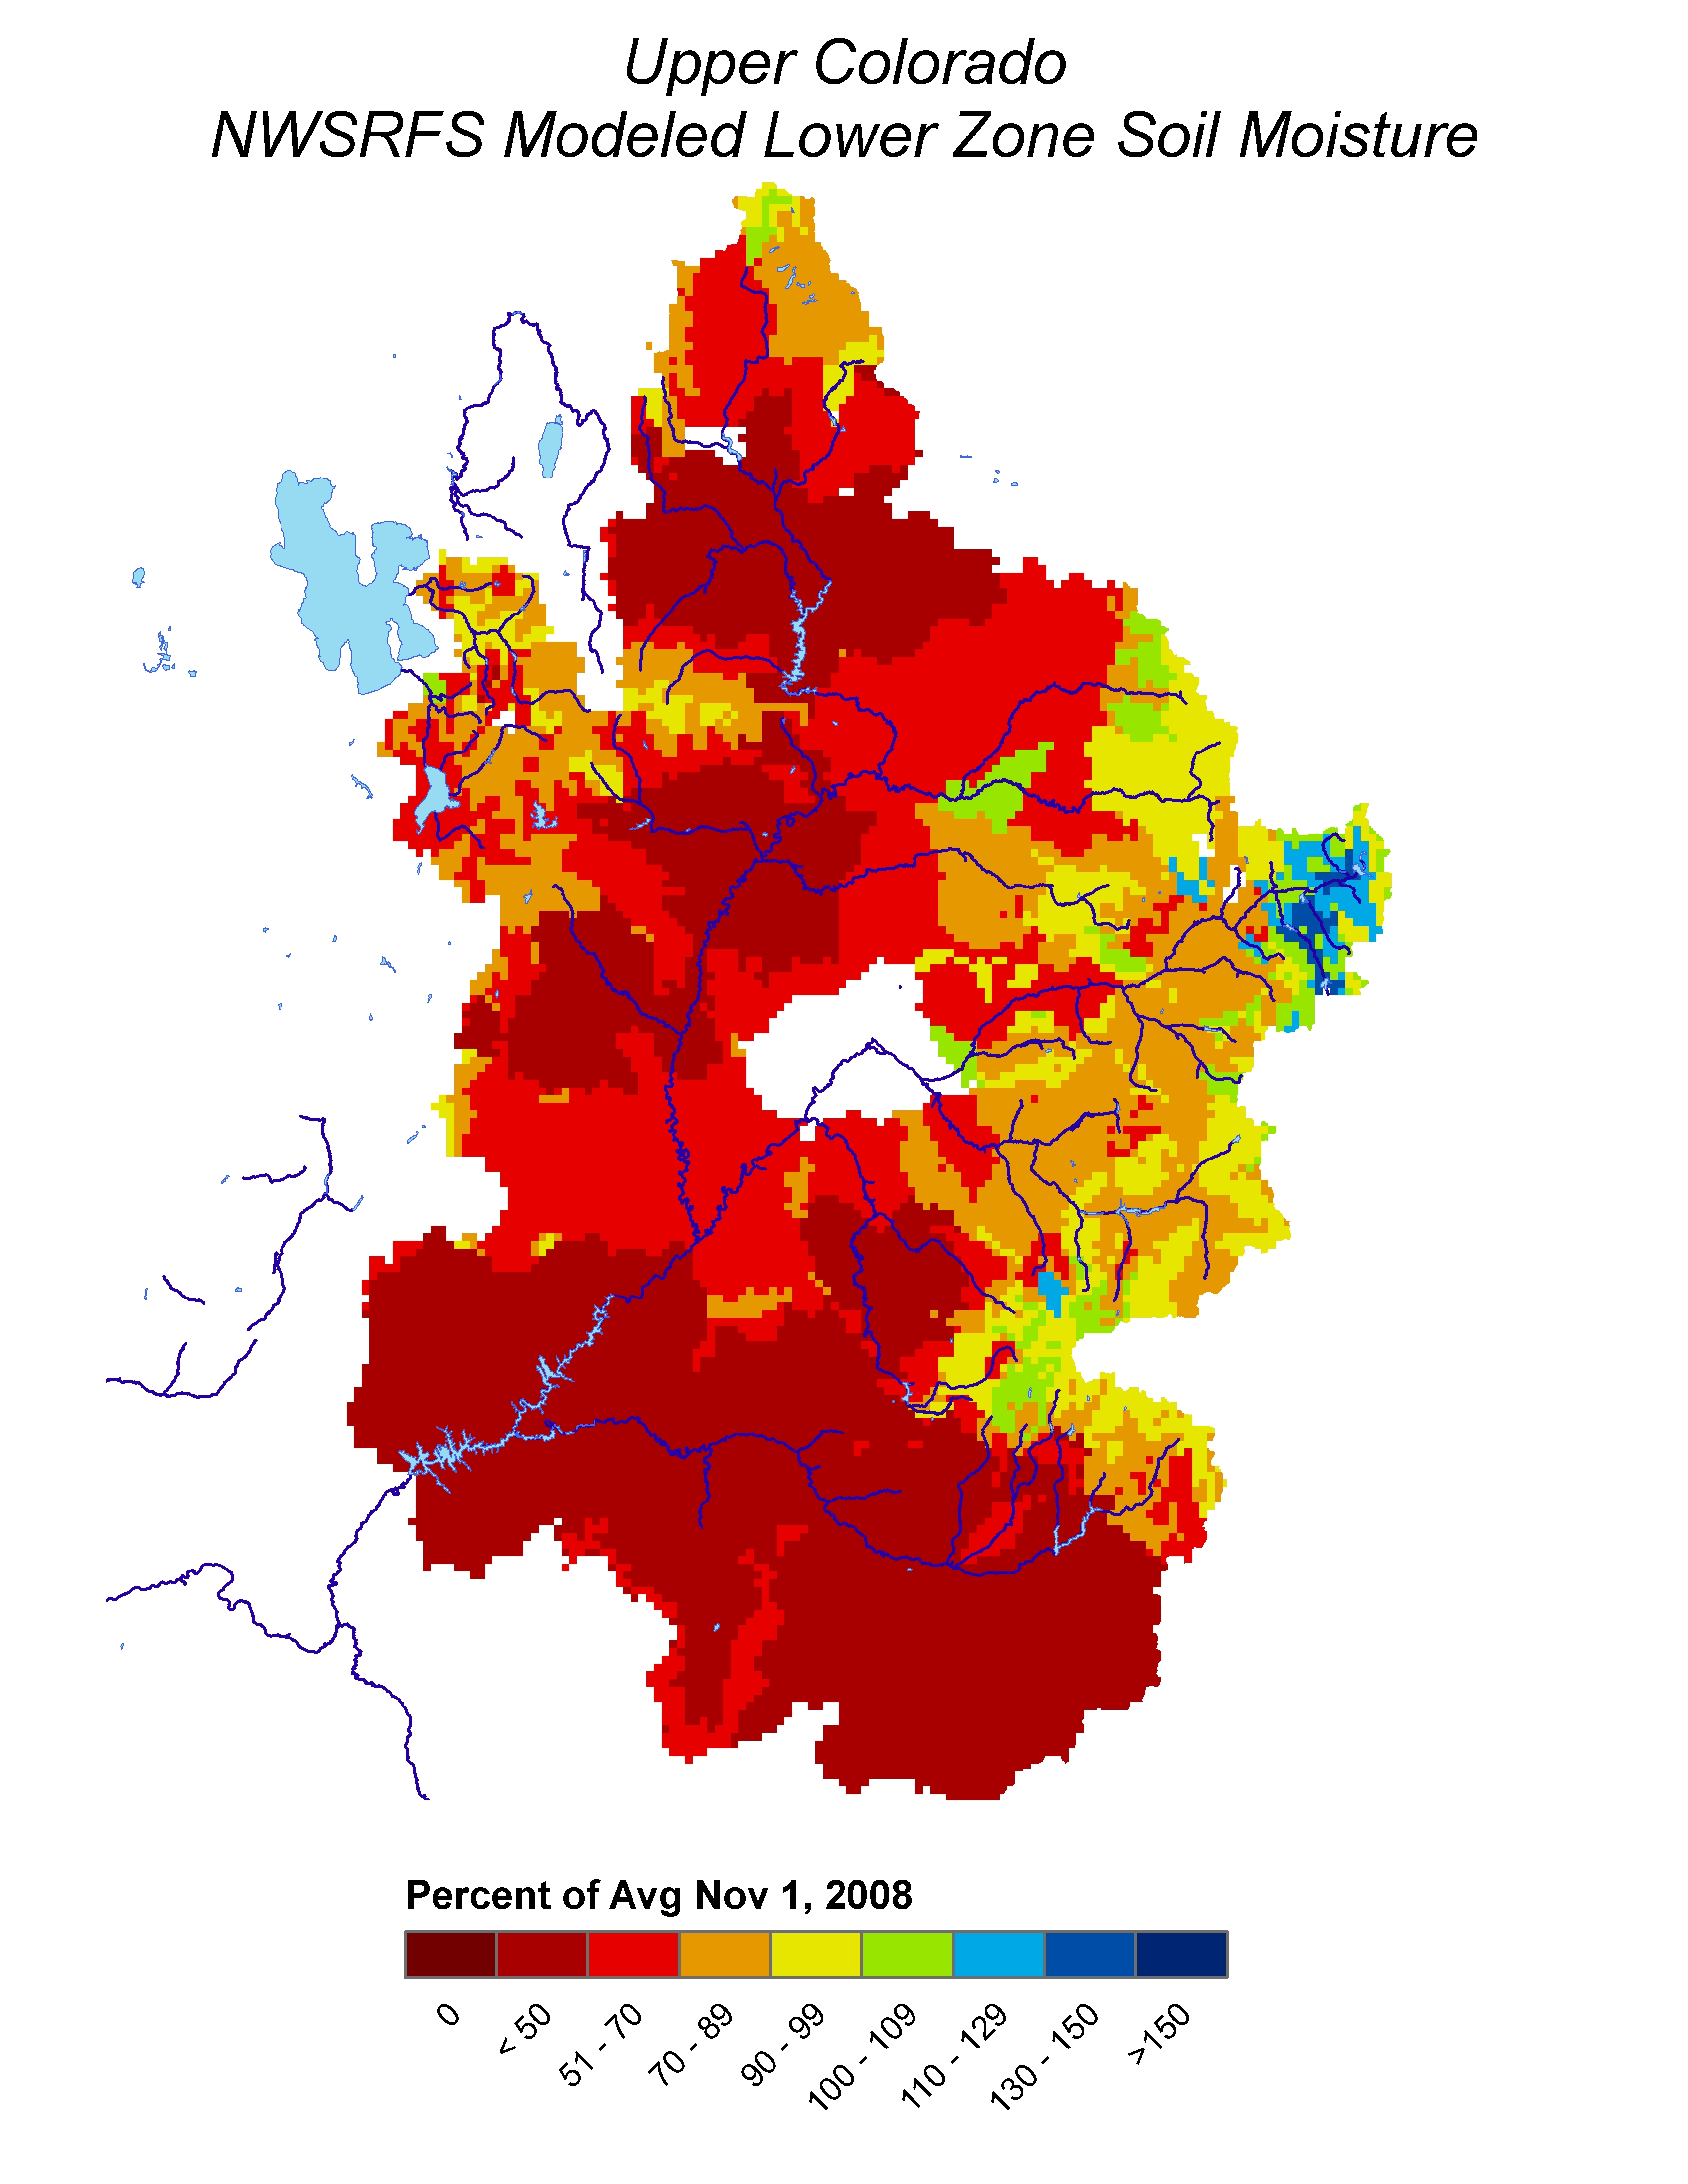
-Model Soil Moisture/Observed Streamflow...
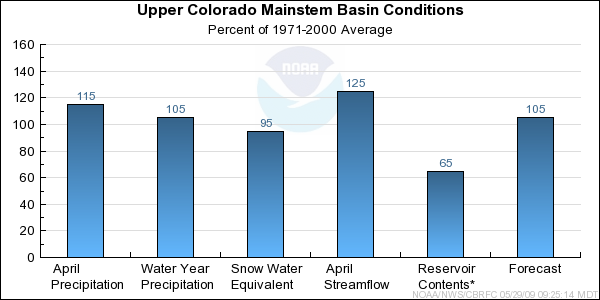
Soil moisture was near to above average in the Upper Colorado heading into the winter. April streamflow was 125% of average. This was due, in large part, to elevated flows during the last 10 days of the month when there was decreased storminess and above average temperatures.
-Snowpack/Precipitation... After two months of below average precipitation, the Upper Colorado River Basin received 115% of average precipitation during April.
Snow water equivalent was 95% of average on May 1st, however it peaked around 115% of the seasonal average peak on April 20th.
-Short Term Precipitation Forecast... As of May 6th, meteorological models were predicting increased chances for above normal temperatures and below normal precipitation through the middle of May.
-General Discussion... Most of the April through July volume forecasts stayed the same or increased slightly from the April 1st issuance. The most notable exceptions were decreases that occurred at Plateau Creek, which went from 91% to 80%, and Mill Creek, which went from 70% to 56%. The April through July streamflow volume forecasts now range between 56% and 111% of average, with a median value of 105%. The May through July streamflow volume forecasts now range between 53% and 109% of average, with a median value of 105%.
* Percent usable capacity, not percent average contents.
Click for multi-month Graph.
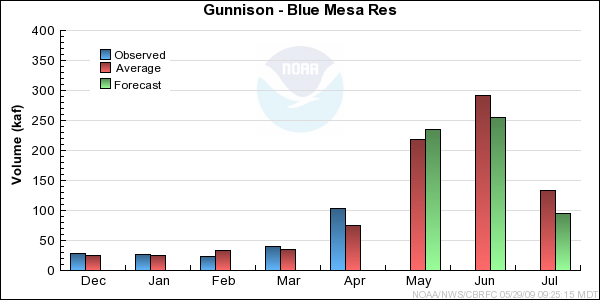
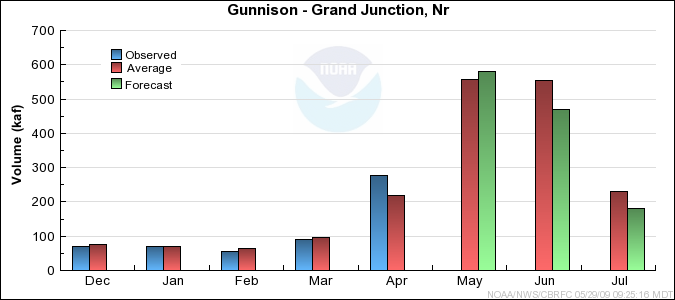
Gunnison Basin Conditions
-Model Soil Moisture/Observed Streamflow...
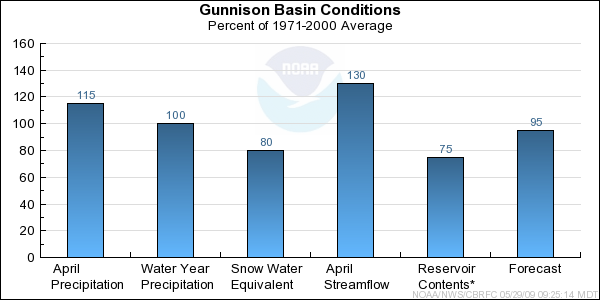
Soil moisture for most of the upper basins in the Gunnison was near to slightly below average in the fall. Observed streamflow for the month of April was above average for the Gunnison.
-Snowpack/Precipitation... Precipitation over the Gunnison Basin for April ranged from average in the lower basin to much above average for the headwater basins. The May 1st
snow water equivalent percent of average was 80 percent. Seasonal precipitation for the Gunnison is 100 percent of average.
-Short Term Precipitation Forecast... As of May 6th, meteorological models were predicting increased chances for above normal temperatures and below normal precipitation through the middle of May.
-General Discussion... April-July forecasts remained unchanged for the Gunninson Basin except for the North Fork of the Gunnison, which has a slight decrease. The median April-July forecast for the Gunnison Basin remains at 95 percent of average.
* Percent usable capacity, not percent average contents.
Click for multi-month Graph.
Dolores Basin Conditions
-Model Soil Moisture/Observed Streamflow...
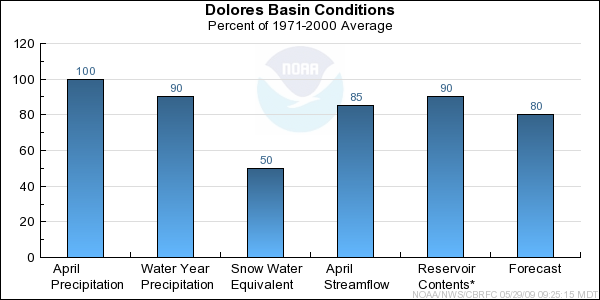
Soil moisture for most of the upper basins in the Dolores was below average in the fall. This was most likely due to limited monsoonal precipitation during the summer months. Observed streamflow for the month of April was below average for the Dolores.
-Snowpack/Precipitation... As of May 1st,
snow water equivalent
across the Dolores was 50 percent of average. The Dolores Basin recieved average precipitation for April. Seasonal precipitation for the Dolores Basin is at 90 percent of average.
-Short Term Precipitation Forecast... As of May 6th, meteorological models were predicting increased chances for above normal temperatures and below normal precipitation through the middle of May.
-General Discussion... With much of the snow pack below 10,000 feet melted and stream flow being below average in the Dolores Basin, April-July volume forecasts have been lowered slightly. The median April-July forecast is now at 80 percent of average, a 5 percent decrease from April 1st.
* Percent usable capacity, not percent average contents.
Click for multi-month Graph.
Differences between the full period forecasts and the residual forecasts may not exactly equal the actual observed volumes due to rounding conventions (see Definitions section).
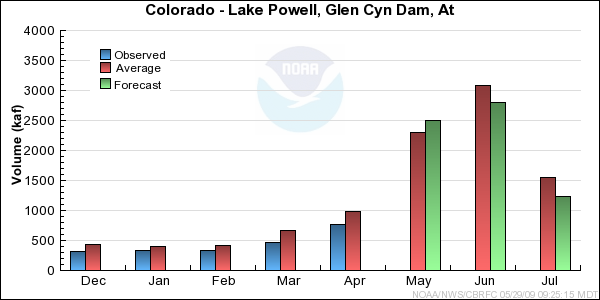
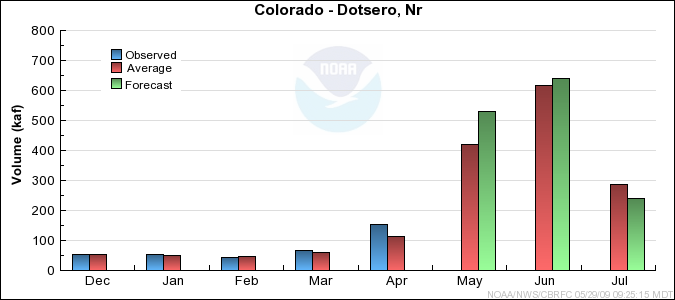
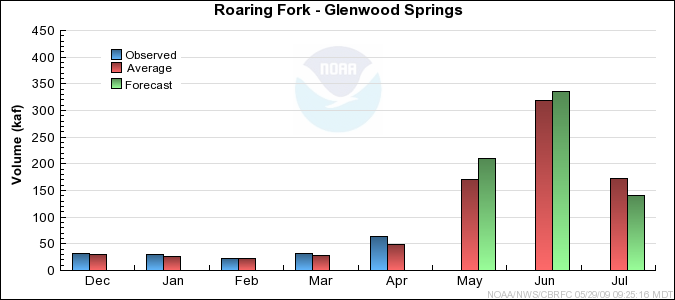
Reservoir Monthly Inflow Forecasts
Monthly Streamflows
Precipitation Maps
Hydrologist: Brenda Alcorn, Tracy Cox
