
NOAA, National Weather Service
Colorado Basin River Forecast Center
Salt Lake City, Utah
www.cbrfc.noaa.gov
| Prepared by Brenda Alcorn, Tracy Cox NOAA, National Weather Service Colorado Basin River Forecast Center Salt Lake City, Utah www.cbrfc.noaa.gov |
| Forecast Period | 90% Exceedance Volume | 50% Exceedance Volume | Percent Average | 10% Exceedance Volume | |
| Colorado | |||||
| Lake Granby, Granby, Nr | April-July | 200 | 230 | 102 | 265 |
| June-July | 99 | 129 | 83 | 163 | |
| Willow Ck | |||||
| Willow Ck Res, Granby, Nr | April-July | 48 | 52 | 102 | 57 |
| June-July | 7.1 | 11 | 46 | 16 | |
| Fraser | |||||
| Winter Park | April-July | 18 | 21 | 105 | 24 |
| June-July | 11 | 14 | 92 | 17 | |
| Williams Fork | |||||
| Williams Fork Res, Parshall, Nr | April-July | 97 | 110 | 116 | 125 |
| June-July | 46 | 59 | 87 | 74 | |
| Muddy Ck | |||||
| Wolford Mtn Res, Blo | April-July | 49 | 55 | 92 | 64 |
| June-July | 8.8 | 15 | 71 | 24 | |
| Blue | |||||
| Dillon Res | April-July | 161 | 185 | 111 | 215 |
| June-July | 85 | 109 | 92 | 137 | |
| Green Mtn Res | April-July | 275 | 315 | 113 | 365 |
| June-July | 139 | 180 | 90 | 230 | |
| Colorado | |||||
| Kremmling, Nr | April-July | 880 | 970 | 111 | 1050 |
| June-July | 380 | 470 | 85 | 550 | |
| Eagle | |||||
| Gypsum, Blo | April-July | 325 | 375 | 112 | 435 |
| June-July | 139 | 190 | 84 | 250 | |
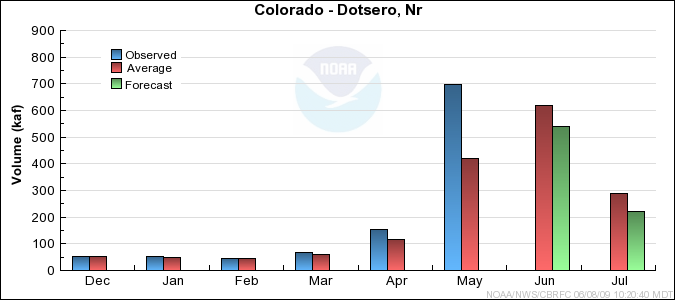
| Colorado | |||||
| Dotsero, Nr | April-July | 1470 | 1610 | 112 | 1770 |
| June-July | 620 | 760 | 84 | 920 | |
| Frying Pan | |||||
| Ruedi Res, Basalt, Nr | April-July | 127 | 150 | 106 | 179 |
| June-July | 54 | 77 | 80 | 106 | |
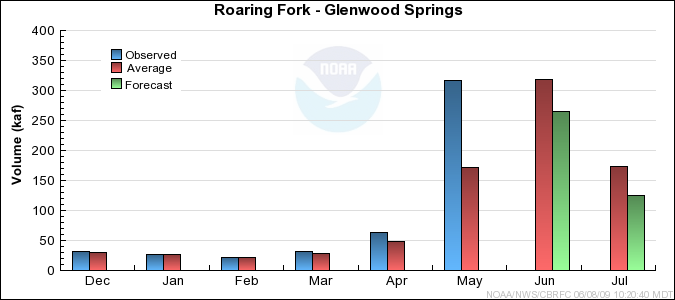
| Roaring Fork | |||||
| Glenwood Springs | April-July | 690 | 770 | 108 | 865 |
| June-July | 310 | 390 | 80 | 485 | |
| Colorado | |||||
| Glenwood Springs, Blo | April-July | 2160 | 2350 | 109 | 2560 |
| June-July | 970 | 1160 | 83 | 1370 | |
| Cameo, Nr | April-July | 2440 | 2670 | 110 | 2890 |
| June-July | 1050 | 1280 | 84 | 1500 | |
| Plateau Ck | |||||
| Cameo, Nr | April-July | 107 | 112 | 97 | 122 |
| June-July | 15 | 20 | 43 | 30 | |
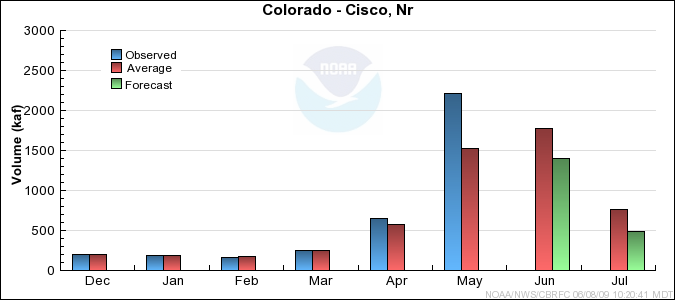
| Colorado | |||||
| Cisco, Nr | April-July | 4360 | 4750 | 102 | 5160 |
| June-July | 1500 | 1890 | 74 | 2300 | |
| Mill Ck | |||||
| Moab, Nr, Sheley Tun, At | April-July | 2.3 | 2.8 | 56 | 3.4 |
| June-July | 0.64 | 1.1 | 44 | 1.7 | |
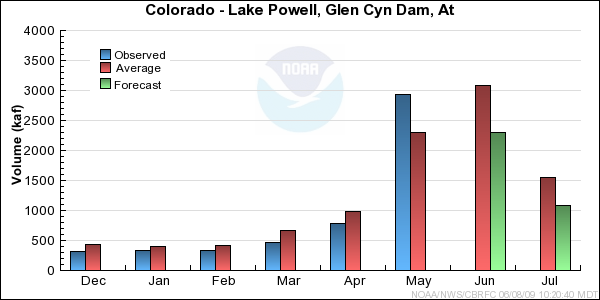
| Colorado | |||||
| Lake Powell, Glen Cyn Dam, At | April-July | 6220 | 7100 | 90 | 7720 |
| June-July | 2500 | 3380 | 73 | 4000 |
| Forecast Period | 90% Exceedance Volume | 50% Exceedance Volume | Percent Average | 10% Exceedance Volume | |
| Taylor | |||||
| Taylor Park Res | April-July | 97 | 110 | 107 | 125 |
| June-July | 39 | 52 | 76 | 67 | |
| Almont | April-July | 144 | 175 | 106 | 205 |
| June-July | 54 | 83 | 79 | 112 | |
| East | |||||
| Almont | April-July | 197 | 220 | 115 | 245 |
| June-July | 76 | 99 | 84 | 125 | |
| Gunnison | |||||
| Gunnison, Nr | April-July | 390 | 445 | 114 | 475 |
| June-July | 150 | 205 | 85 | 235 | |
| Tomichi Ck | |||||
| Gunnison | April-July | 68 | 82 | 101 | 101 |
| June-July | 19.1 | 33 | 77 | 52 | |
| Lake Fork | |||||
| Gateview | April-July | 122 | 135 | 107 | 150 |
| June-July | 46 | 59 | 67 | 74 | |
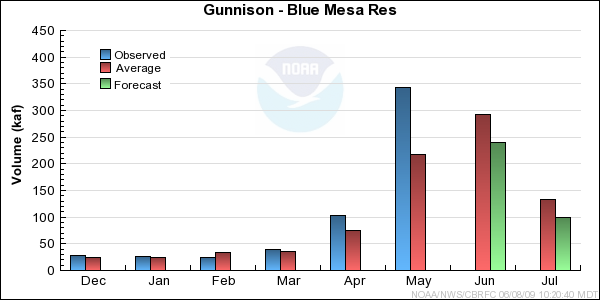
| Gunnison | |||||
| Blue Mesa Res | April-July | 725 | 790 | 110 | 850 |
| June-July | 275 | 340 | 80 | 400 | |
| Morrow Point Res | April-July | 760 | 860 | 110 | 960 |
| June-July | 245 | 365 | 80 | 480 | |
| Crystal Res | April-July | 830 | 965 | 105 | 1100 |
| June-July | 260 | 405 | 77 | 550 | |
| Muddy Ck | |||||
| Paonia Res, Bardine, Nr | March-June | 87 | 93 | 93 | 102 |
| April-July | 82 | 90 | 88 | 102 | |
| June-June | 6.7 | 13 | 48 | 22 | |
| June-July | 8 | 16 | 48 | 28 | |
| Nf Gunnison | |||||
| Somerset, Nr | April-July | 295 | 320 | 105 | 350 |
| June-July | 58 | 82 | 63 | 112 | |
| Surface Ck | |||||
| Cedaredge | April-July | 15.1 | 17 | 99 | 19.5 |
| June-July | 4 | 5.9 | 71 | 8.4 | |
| Uncompahgre | |||||
| Ridgway Res | April-July | 89 | 100 | 98 | 114 |
| June-July | 29 | 40 | 58 | 54 | |
| Colona | April-July | 118 | 135 | 97 | 158 |
| June-July | 32 | 49 | 56 | 72 | |
| Delta | April-July | 68 | 120 | 103 | 172 |
| June-July | 5.2 | 39 | 62 | 73 | |
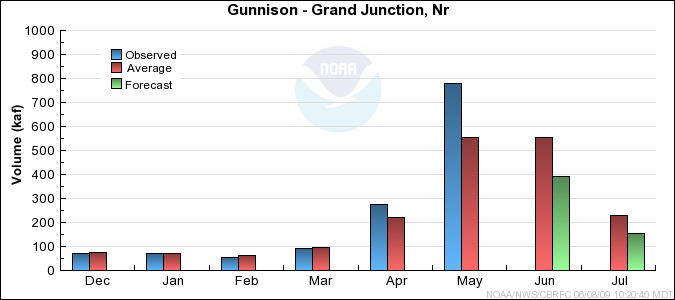
| Gunnison | |||||
| Grand Junction, Nr | April-July | 1440 | 1600 | 103 | 1740 |
| June-July | 380 | 545 | 69 | 685 |
| Forecast Period | 90% Exceedance Volume | 50% Exceedance Volume | Percent Average | 10% Exceedance Volume | |
| Dolores | |||||
| Dolores | April-July | 196 | 215 | 81 | 245 |
| June-July | 18.7 | 38 | 34 | 67 | |
| Mcphee Res | April-July | 220 | 250 | 78 | 270 |
| June-July | 17.8 | 47 | 36 | 66 | |
| San Miguel | |||||
| Placerville, Nr | April-July | 97 | 110 | 83 | 126 |
| June-July | 31 | 44 | 54 | 60 | |
| Dolores | |||||
| Cisco, Nr | April-July | 230 | 385 | 63 | 540 |
| June-July | 45 | 60 | 27 | 75 |
| Range | Round to | |
| 0-1.99 | 0.01 | |
| 2.0-19.9 | 0.1 | |
| 20-199 | 1.0 | |
| 200-999 | 5.0 | |
| 1000+ | 3 significant digits |