
NOAA, National Weather Service
Colorado Basin River Forecast Center
Salt Lake City, Utah
www.cbrfc.noaa.gov
| Prepared by Brenda Alcorn, Tracy Cox NOAA, National Weather Service Colorado Basin River Forecast Center Salt Lake City, Utah www.cbrfc.noaa.gov |

| Forecast Period | 90% Exceedance Volume | 50% Exceedance Volume | Percent Average | 10% Exceedance Volume | |
| Colorado | |||||
| Lake Granby, Granby, Nr | April-July | 385 | 430 | 191 | 475 |
| June-July | 310 | 355 | 228 | 400 | |
| Willow Ck | |||||
| Willow Ck Res, Granby, Nr | April-July | 108 | 120 | 235 | 133 |
| June-July | 63 | 75 | 313 | 88 | |
| Fraser | |||||
| Winter Park | April-July | 26 | 30 | 150 | 34 |
| June-July | 23 | 27 | 176 | 31 | |
| Williams Fork | |||||
| Williams Fork Res, Parshall, Nr | April-July | 143 | 160 | 168 | 178 |
| June-July | 109 | 126 | 185 | 144 | |
| Muddy Ck | |||||
| Wolford Mtn Res, Blo | April-July | 95 | 115 | 192 | 139 |
| June-July | 45 | 65 | 310 | 89 | |
| Blue | |||||
| Dillon Res | April-July | 240 | 265 | 159 | 295 |
| June-July | 197 | 225 | 189 | 255 | |
| Green Mtn Res | April-July | 405 | 455 | 163 | 510 |
| June-July | 325 | 375 | 188 | 430 | |
| Colorado | |||||
| Kremmling, Nr | April-July | 1430 | 1600 | 184 | 1770 |
| June-July | 1000 | 1170 | 211 | 1340 | |
| Eagle | |||||
| Gypsum, Blo | April-July | 445 | 510 | 152 | 580 |
| June-July | 350 | 415 | 184 | 485 | |
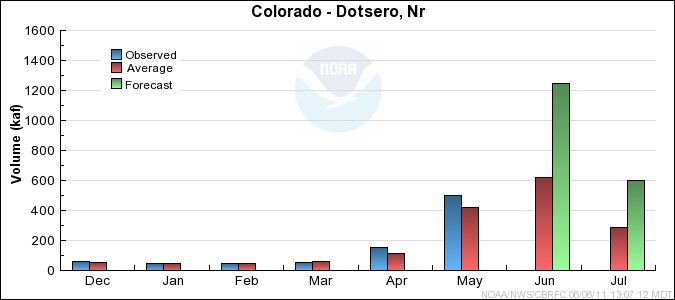
| Colorado | |||||
| Dotsero, Nr | April-July | 2250 | 2500 | 174 | 2770 |
| June-July | 1600 | 1850 | 204 | 2120 | |
| Frying Pan | |||||
| Ruedi Res, Basalt, Nr | April-July | 173 | 200 | 142 | 225 |
| June-July | 139 | 166 | 173 | 193 | |
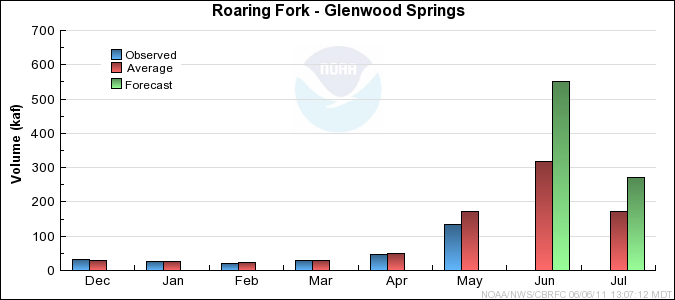
| Roaring Fork | |||||
| Glenwood Springs | April-July | 880 | 1000 | 141 | 1100 |
| June-July | 700 | 820 | 167 | 925 | |
| Colorado | |||||
| Glenwood Springs, Blo | April-July | 3080 | 3490 | 162 | 3820 |
| June-July | 2270 | 2680 | 191 | 3010 | |
| Cameo, Nr | April-July | 3610 | 4000 | 165 | 4410 |
| June-July | 2620 | 3010 | 197 | 3420 | |
| Plateau Ck | |||||
| Cameo, Nr | April-July | 117 | 178 | 155 | 205 |
| June-July | 50 | 111 | 236 | 140 | |
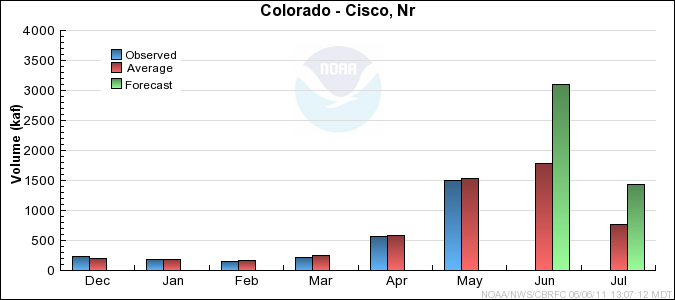
| Colorado | |||||
| Cisco, Nr | April-July | 5970 | 6600 | 142 | 7280 |
| June-July | 3900 | 4530 | 178 | 5210 | |
| Mill Ck | |||||
| Moab, Nr, Sheley Tun, At | April-July | 4.4 | 5.3 | 106 | 6.4 |
| June-July | 2.5 | 3.4 | 136 | 4.5 | |
| Colorado | |||||
| Lake Powell, Glen Cyn Dam, At | April-July | 11000 | 12600 | 159 | 14400 |
| June-July | 7800 | 9400 | 203 | 11200 |
| Forecast Period | 90% Exceedance Volume | 50% Exceedance Volume | Percent Average | 10% Exceedance Volume | |
| Taylor | |||||
| Taylor Park Res | April-July | 115 | 135 | 131 | 157 |
| June-July | 86 | 106 | 156 | 128 | |
| Almont | April-July | 180 | 200 | 121 | 230 |
| June-July | 131 | 151 | 144 | 180 | |
| East | |||||
| Almont | April-July | 230 | 255 | 133 | 280 |
| June-July | 165 | 190 | 161 | 215 | |
| Gunnison | |||||
| Gunnison, Nr | April-July | 460 | 510 | 131 | 565 |
| June-July | 330 | 380 | 158 | 435 | |
| Tomichi Ck | |||||
| Gunnison | April-July | 64 | 81 | 100 | 102 |
| June-July | 38 | 55 | 128 | 76 | |
| Lake Fork | |||||
| Gateview | April-July | 122 | 140 | 111 | 160 |
| June-July | 99 | 117 | 133 | 137 | |
| Gunnison | |||||
| Blue Mesa Res | April-July | 820 | 895 | 124 | 970 |
| June-July | 575 | 650 | 153 | 725 | |
| Morrow Point Res | April-July | 900 | 970 | 124 | 1070 |
| June-July | 625 | 695 | 153 | 815 | |
| Crystal Res | April-July | 980 | 1080 | 118 | 1200 |
| June-July | 685 | 780 | 149 | 905 | |
| Muddy Ck | |||||
| Paonia Res, Bardine, Nr | March-June | 114 | 127 | 127 | 142 |
| April-July | 116 | 134 | 131 | 154 | |
| June-June | 41 | 54 | 200 | 69 | |
| June-July | 48 | 66 | 200 | 86 | |
| Nf Gunnison | |||||
| Somerset, Nr | April-July | 350 | 380 | 125 | 410 |
| June-July | 175 | 205 | 158 | 235 | |
| Surface Ck | |||||
| Cedaredge | April-July | 17.7 | 21 | 123 | 25 |
| June-July | 9.8 | 13 | 157 | 16.9 | |
| Uncompahgre | |||||
| Ridgway Res | April-July | 105 | 119 | 117 | 135 |
| June-July | 76 | 90 | 130 | 106 | |
| Colona | April-July | 134 | 163 | 117 | 195 |
| June-July | 91 | 120 | 136 | 152 | |
| Delta | April-July | 112 | 123 | 105 | 165 |
| June-July | 64 | 75 | 119 | 117 | |
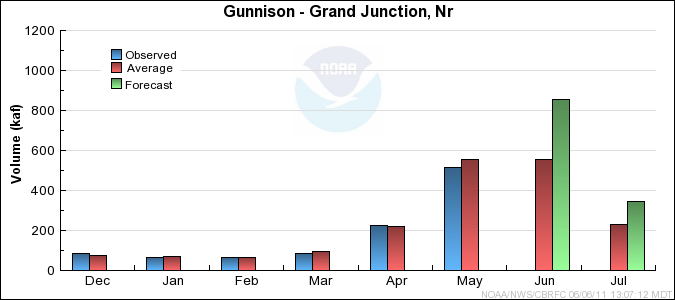
| Gunnison | |||||
| Grand Junction, Nr | April-July | 1740 | 1940 | 124 | 2160 |
| June-July | 1000 | 1200 | 153 | 1420 |
| Forecast Period | 90% Exceedance Volume | 50% Exceedance Volume | Percent Average | 10% Exceedance Volume | |
| Dolores | |||||
| Dolores | April-July | 188 | 215 | 81 | 250 |
| June-July | 77 | 105 | 93 | 139 | |
| Mcphee Res | April-July | 230 | 260 | 81 | 290 |
| June-July | 87 | 115 | 88 | 147 | |
| San Miguel | |||||
| Placerville, Nr | April-July | 106 | 123 | 93 | 143 |
| June-July | 73 | 90 | 111 | 110 | |
| Dolores | |||||
| Cisco, Nr | April-July | 440 | 465 | 76 | 545 |
| June-July | 171 | 195 | 87 | 275 |
| Range | Round to | |
| 0-1.99 | 0.01 | |
| 2.0-19.9 | 0.1 | |
| 20-199 | 1.0 | |
| 200-999 | 5.0 | |
| 1000+ | 3 significant digits |
