New 1981-2010 Averages being used this year.
Note: This publication is currently undergoing major revisions. The current publication will be replaced with a new publication based on stakeholder requirements and scientific advances. We expect to begin sharing details on this soon. If you have input on content, format, or publication frequency at any time, please contact us at cbrfc.webmasters@noaa.gov.Upper Colorado Water Supply Outlook, June 1, 2012

Upper Colorado Water Supply Outlook, June 1, 2012


Prepared by Brenda Alcorn, Greg Smith
NOAA, National Weather Service
Colorado Basin River Forecast Center
Salt Lake City, Utah
www.cbrfc.noaa.gov

Contents

Upper Colorado Summary


*Median of forecasts within each basin.


Upper Colorado Mainstem Basin Conditions

The following conditions influenced this month's forecasts:

Precipitation:
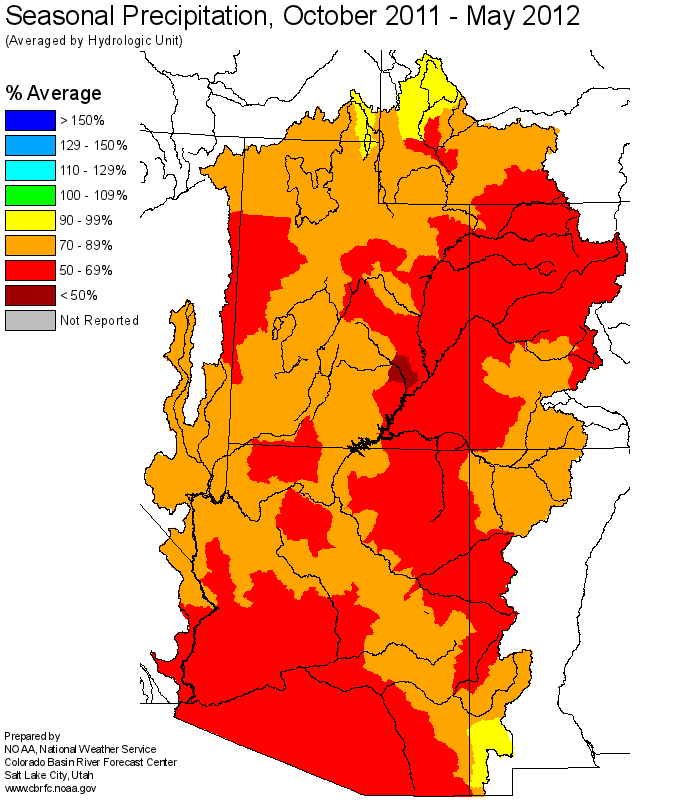
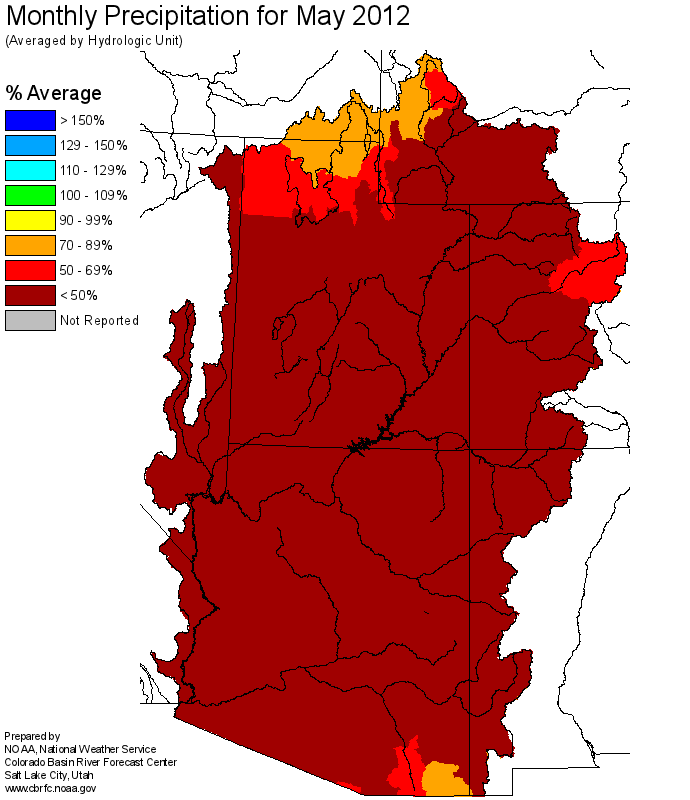
Seasonal October through May precipitation was near 65 percent of average in the Upper Colorado mainstem basin. May was the third month in a row with much below average precipitation coming in at just 35 percent of average.

Snow:
As of June 1st there was essentially no snow left at any of the SNOTEL sites within the Upper Colorado mainstem basin. Many of these sites melted out at the earliest time in their 30 year history this year.
--- Upper Colorado basin snow water equivalent plot

Streamflow:
May streamflow was much below average in the basin as a whole. Monthly volumes at individual sites ranged from 20 to 70 percent of average.

Soil Moisture:
Modeled soil moisture states were above average heading into the winter.

Climate Forecasts:
La Nina climate conditions existed throughout the winter but these do not show a strong correlation with winter precipitation in the Upper Colorado mainstem basin, and therefore were not influential in the development of streamflow volume forecasts.

Forecast Summary:
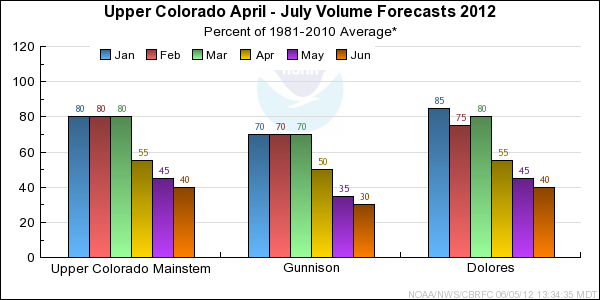
A wet October was followed by much below average precipitation in November and December. Near average precipitation occurred in January and February. March, April and May were warm and dry causing the early meltout of a near record low snowpack. As a result, the seasonal runoff forecasts have been continually reduced the last few months. Most of the June through July forecasts are for volumes that would be the 2nd lowest on record if they occurred, while most of the April through July forecasts would be in the bottom 3 of their historical records. Current June through July streamflow volume forecasts range between 12 and 35 percent of average with a median value of 30 percent. Current April through July streamflow volume forecasts range between 30 and 50 percent of average with a median value of 40 percent.
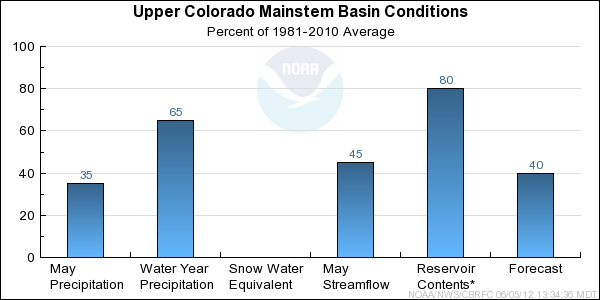


* Percent usable capacity, not percent average contents.
Click for multi-month Graph.

Gunnison Basin Conditions

The following conditions influenced this month's forecasts:

Precipitation:
Seasonal October through May precipitation ranged from 50 to 80 percent of average in most of the Gunnison River Basin.

For the third consecutive month very dry conditions were experienced in the Gunnison Basin. May precipitation ranged from 10 to 50 percent of average at most locations. The Basin average precipitation was 30 percent of average.

Snow:
The snow had melted out of nearly all measuring sites by June 1st. The snow melt was very early this season due to the warm dry spring. Many sites were void of snow a full 4 to 6 weeks earlier than average.

Gunnison Basin snow water equivalent plot

Streamflow:
Streamflow volumes for May were much below average due to the lack of snow. Runoff volumes for the month of May ranged from 25 to 70 percent of average at most locations. Volumes below 20 percent of average occurred at lower elevation streams where snow had melted out during April.

Soil Moisture:
Modeled soil moisture states were above average entering the winter season.

Climate Forecasts:
La Nina climate conditions existed throughout the winter but these do not show a strong correlation with winter precipitation or Apri-July runoff volumes in the Gunnison Basin. Therefore they were not influential in the development of streamflow volume forecasts.

Forecast Summary:
The 2012 season was defined by extremely dry and warm conditions during the spring, with record or near record low snow amounts due the dry conditions and early snow melt. Seasonal runoff forecasts were progressively reduced throughout the season as the dry conditions persisted. Forecast runoff volumes were reduced slightly from those issued in early May. Several April-July forecasts are the 2nd or 3rd lowest on record. For June-July many some volume forecasts are the lowest on record.Record Seasonal April-July streamflow runoff volumes are expected to range from near 10 to 50 percent of the 1981-2010 average. June-July streamflow runoff volumes are expected to range from near 5 to 30 percent of average.
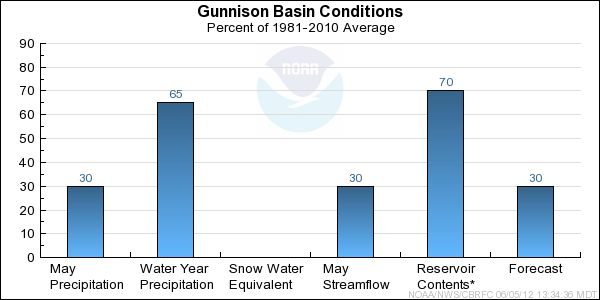


* Percent usable capacity, not percent average contents.
Click for multi-month Graph.

Dolores Basin Conditions

The following conditions influenced this month's forecasts:

Precipitation:
Seasonal October through May precipitation ranged between 60 and 85 percent of average at most locations in the Dolores Basin.

May was the third consecutive month with very dry conditions in the Dolores Basin. May precipitation ranged from 0 to 15 percent of average at most locations. The Basin average precipitation was near 5 percent of average.

Snow:
The snow had melted out of nearly all measuring sites by June 1st. The snow melt was very early this season due to the warm dry spring. Many sites were void of snow a full 4 to 6 weeks earlier than average.

Dolores Basin snow water equivalent plot

Streamflow:
Streamflow volumes for May ranged from 35 to 65 percent of average in the Dolores Basin.

Soil Moisture:
Modeled soil moisture states were near average entering the winter season.

Climate Forecasts:
La Nina climate conditions existed throughout the winter but these do not show a strong correlation with winter precipitation or April-July runoff volumes in the Dolores Basin. Therefore, it was not influential in the development of streamflow volume forecasts.

Forecast Summary:
The 2012 season was defined by extremely dry and warm conditions during the spring, with record or near record low snow amounts due the dry conditions and early snow melt. Seasonal runoff forecasts were progressively reduced throughout the season as the dry conditions persisted. Forecast runoff volumes were reduced slightly from those issued in early May. Some forecasts are among the bottom 5 on record. Forecast April-July streamflow runoff volumes are expected to range from 30 to 45 percent of the 1981-2010 average. June-July streamflow runoff volumes are expected to range between 15 and 30 percent of average.
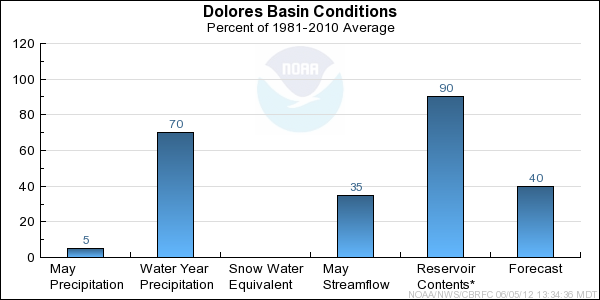


* Percent usable capacity, not percent average contents.
Click for multi-month Graph.


Upper Colorado Mainstem Specific Site Forecasts (kaf)

Click site name for graph.
Forecast
Period
90%
Exceedance
Volume
50%
Exceedance
Volume
Percent
Average
10%
Exceedance
Volume
Colorado
Lake Granby, Granby, Nr April-July9611050127
June-July31453162
Willow Ck
Willow Ck Res, Granby, Nr April-July18214524
June-July24.5218
Fraser
Winter Park April-July7.19.14711.1
June-July35357
Williams Fork
Williams Fork Res, Parshall, Nr April-July36424450
June-July15.3223430
Muddy Ck
Wolford Mountain Reservoir April-July17213928
June-July0.4242111.2
Blue
Dillon Res April-July59704382
June-July24353247
Green Mtn Res April-July10412545149
June-July44653589
Colorado
Kremmling, Nr April-July30535541420
June-July10015029215
Eagle
Gypsum, Blo April-July11513741164
June-July33552682
Colorado
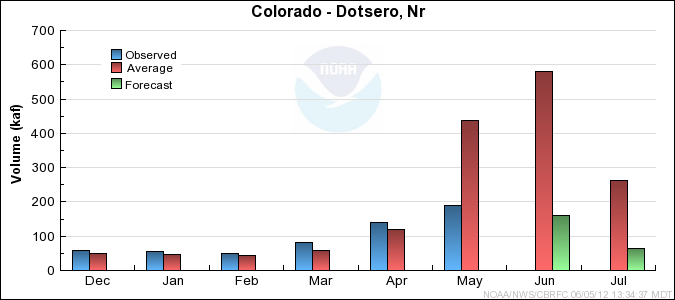
Dotsero, Nr April-July47555540655
June-July14322527325
Frying Pan
Ruedi Res, Basalt, Nr April-July43574174
June-July9.2232640
Roaring Fork
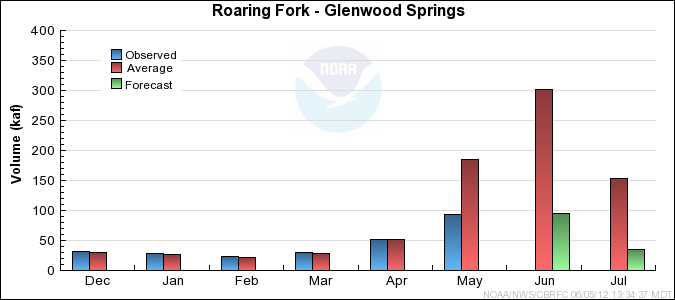
Glenwood Springs April-July20527540345
June-July6213029198
Colorado
Glenwood Springs, Blo April-July740880421030
June-July22536528515
Cameo, Nr April-July800930391080
June-July25038027535
Plateau Ck
Cameo, Nr April-July34393145
June-July1612.211.8
Colorado
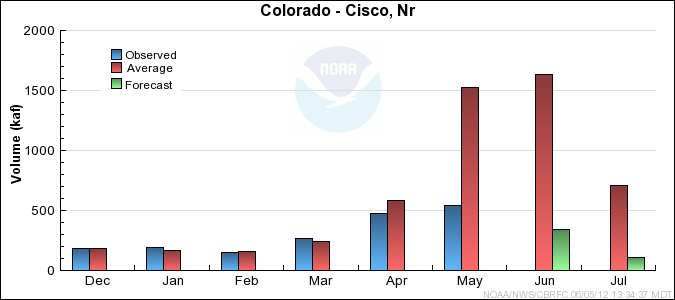
Cisco, Nr April-July12901470331700
June-July27045019.2680
Mill Ck
Moab, Nr, Sheley Tun, At April-July1.11.3311.7
June-July0.270.5230.84
Colorado
Lake Powell, Glen Cyn Dam, At April-July17102010282450
June-July15845012890


Gunnison Specific Site Forecasts (kaf)

Click site name for graph.
Forecast
Period
90%
Exceedance
Volume
50%
Exceedance
Volume
Percent
Average
10%
Exceedance
Volume
Taylor
Taylor Park Res April-July33393947
June-July6.7132121
Almont April-July49523457
June-July12151620
East
Almont April-July51583267
May-July44583567
June-July11181727
Gunnison
Gunnison, Nr April-July839526111
June-July15.6281344
Tomichi Ck
Gunnison April-July5.26.38.58.2
June-July0.925.43.9
Lake Fork
Gateview April-July53604969
June-July16.2243033
Gunnison
Blue Mesa Res April-July17419629220
June-July436517.191
Morrow Point Res April-July18821028235
June-July446616.392
Crystal Res April-July20522527250
June-July466814.994
Muddy Ck
Paonia Res, Bardine, Nr March-June28303133
April-July19.9232428
June-June0.228.75.7
June-July0.3310.38.4
Nf Gunnison
Somerset, Nr April-July808930100
June-July132219.333
Surface Ck
Cedaredge April-July6.46.9417.7
June-July0.8113.21.8
Uncompahgre
Ridgway Res April-July39464654
June-July14.4213229
Colona April-July33423155
June-July6.21518.528
Delta April-July22232027
June-July1.835.37
Gunnison
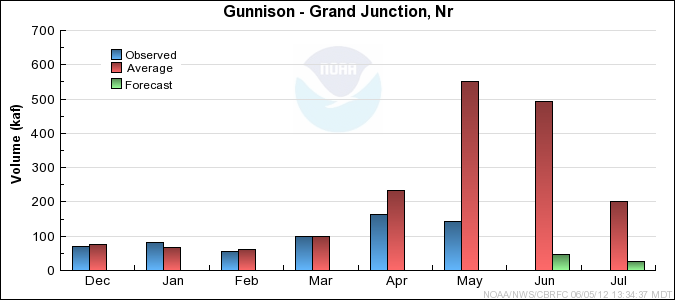
Grand Junction, Nr April-July33538026440
June-July307310.5134


Dolores Specific Site Forecasts (kaf)

Click site name for graph.
Forecast
Period
90%
Exceedance
Volume
50%
Exceedance
Volume
Percent
Average
10%
Exceedance
Volume
Dolores
Dolores April-July10511346125
June-July11.4202232
Mcphee Res April-July10611539130
June-July6.71616.529
San Miguel
Placerville, Nr April-July52584566
June-July14.8212829
Dolores
Cisco, Nr April-July15216730179
June-July213619.648

Differences between the full period forecasts and the residual forecasts may not exactly equal the actual observed volumes due to rounding conventions (see Definitions section).

Reservoir Monthly Inflow Forecasts


Upper Colorado End of Month Reservoir Contents (kaf)

Usable
Capacity
EOM
Contents
Percent
Usable
Capacity
Last Year
EOM
Last Year
%Capacity
untitled Colorado
Lake Granby, Granby, Nr 490.3 376.6 77 311.0 63
untitled Willow Ck
Willow Ck Res, Granby, Nr 9.1 8.2 90 4.0 44
untitled Williams Fork
Williams Fork Res, Parshall, Nr 96.9 91.6 95 79.6 82
untitled Muddy Ck
Wolford Mountain Reservoir 66.0 66.1 100 67.4 102
untitled Blue
Dillon Res 254.0 243.2 96 184.9 73
Green Mtn Res 146.9 102.4 70 67.9 46
untitled Homestake Ck
Homestake Res 43.0 0.3 1 15.4 36
untitled Frying Pan
Ruedi Res, Basalt, Nr 102.0 85.2 83 62.5 61
untitled Plateau Ck
Vega Res, Collbran, Nr 32.9 30.6 93 30.3 92
untitled Taylor
Taylor Park Res 106.2 80.5 76 61.1 58
untitled Gunnison
Blue Mesa Res 829.5 526.7 64 493.4 59
Morrow Point Res 117.0 112.3 96 114.0 97
Crystal Res 17.5 14.9 85 17.1 97
untitled Muddy Ck
Paonia Res, Bardine, Nr 18.5 15.4 83 2.7 15
untitled Uncompahgre
Ridgway Res 83.2 75.1 90 57.5 69
untitled Dolores
Mcphee Res 381.1 338.2 89 366.0 96
untitled
TOTAL 2794.1 2167.5 78 1934.6 69
Colorado
Lake Powell 24322.0 15631.9 64 14097.8 58
untitled
TOTAL 24322.0 15631.9 64 14097.8 58

Monthly Streamflows


Precipitation Maps


Definitions

10% exceedance forecast: Given the current hydrometeorological conditions, i.e current snowpack, soil moisture and streamflow, the volume that has a 10% chance of being exceeded. Previously referred to as "Reasonable Maximum Forecast".

50% exceedance forecast: Given the current hydrometeorological conditions, i.e current snowpack, soil moisture and streamflow, the volume that has a 50% chance of being exceeded. Previously referred to as "Most Probable Forecast".

90% exceedance forecast: Given the current hydrometeorological conditions, i.e current snowpack, soil moisture and streamflow, the volume that has a 90% chance of being exceeded. Previously referred to as "Reasonable Minimum Forecast".

Acre-Foot (af): The volume equal to one acre covered one foot deep (43,560 cubic feet). See kaf below.

Average: The arithmetic mean. The sum of the values divided by the number of values. Values from 1981-2010 are used for this publication.

Categories: Much Above Average=Greater than 130%, Above Average=111-130%, Near Average=90-110%, Below Average=70-89%, Much Below Average=Less than 70%.

CBRFC: Colorado Basin River Forecast Center.

Forecast Period: The period from April 1 through July 31, unless otherwise noted.

kaf: Thousand Acre-Feet. See Acre-Foot above.

Inflow: The volume of water that flows into a reservoir or lake.

Median: The middle value of an ordered set of values. Half of the values are higher and half of the values are lower. When the set contains an even number of values the median is the average of the two middle numbers.

NOAA: National Oceanic and Atomospheric Administration.

NWS: National Weather Service.

Rounding Conventions:
RangeRound to
0-1.990.01
2.0-19.90.1
20-1991.0
200-9995.0
1000+3 significant digits


Streamflow: The volume of water that flows past a specific stream site.

Water Year: The 12-month period, October 1 through September 30. The water year is designated by the calendar year in which it ends. Thus, the year ending September 30, 2008, is called the "2008 water year."


Additional Information

Water supply forecasts take into consideration present hydrometeorological conditions and use average basin temperatures and precipitation for the forecast period. As the forecast season progresses, a greater portion of the future hydrologic and climatic uncertainty becomes known and monthly forecasts become more accurate. For more information on the tools we use, consult Water Supply Forecasting Tools.

Volume forecasts represent adjusted flows; that is, observed flows with upstream water use taken into account. Adjusted flows will closely approximate natural or unimpaired flows. However, not all upstream diversions or impoundments are measured or quantifiable. For specific adjustments used with each forecast point, consult the Guide to Water Supply Forecasting.

The Water Supply Outlook is issued monthly January through May by the Colorado Basin River Forecast Center. It represents a coordinated effort between the National Weather Service, Natural Resources Conservation Service, Bureau of Reclamation, U.S. Geological Survey and local water district managers.

Note: Data used in this report are provisional and are subject to revision.

For more information, or to be included on the mailing list, please contact:

Colorado Basin River Forecast Center
2242 W North Temple
Salt Lake City, UT 84116
(801) 524-5130
www.cbrfc.noaa.gov


Hydrologist: Brenda Alcorn, Greg Smith