Note: This publication is currently undergoing major revisions. The current publication will be replaced with a new publication based on stakeholder requirements and scientific advances. We expect to begin sharing details on this soon. If you have input on content, format, or publication frequency at any time, please contact us at cbrfc.webmasters@noaa.gov.Virgin Water Supply Outlook, January 1, 2010

Virgin Water Supply Outlook, January 1, 2010


Prepared by G. Smith
NOAA, National Weather Service
Colorado Basin River Forecast Center
Salt Lake City, Utah
www.cbrfc.noaa.gov

Contents

Virgin Summary

Forecast Note
Forecasts in this publication are now being referenced to the 1971-2000 median value. Median represents the mid point of all the April-July volumes observed during this 30 year period. Half of the observed volumes are above this value, and half below this value. Historically forecasts were represented as a percent of the 1971-2000 average (or mean) value. However, the average values were skewed by a few very wet years and are not considered the best metric on which to reference forecasts.


*Median of forecasts within each basin.


Virgin Basin Conditions

The following conditions influenced this month's forecasts:

Precipitation:
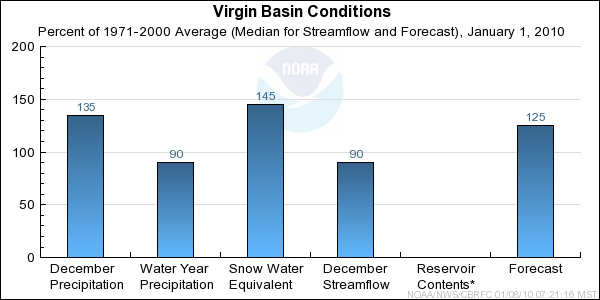
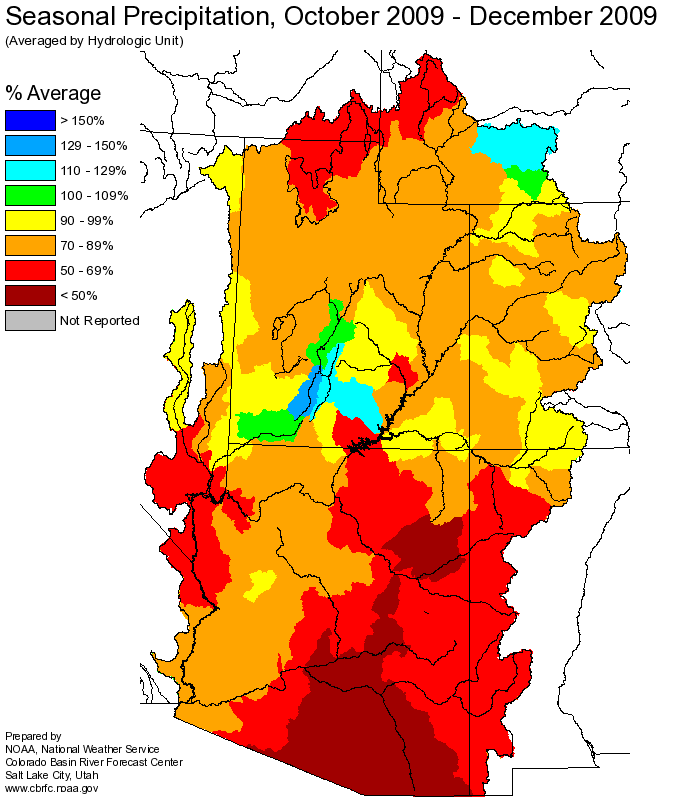
Seasonal October-December precipitation was near 90 percent of average in the Virgin Headwaters, and 65 percent of average basin wide.
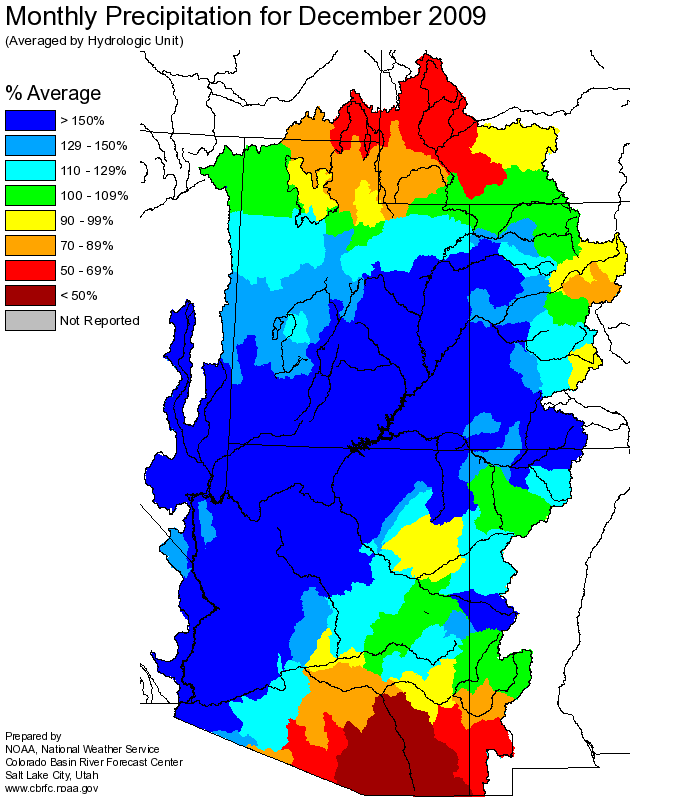
December precipitation was near 190 percent of average in the Virgin Headwaters, and 120 to 170 percent of average throughout the remainder of the basin.

Snow:
January 1st snowpack in the Virgin River Basin ranged from 105 to 290 percent of average. January 1st snowpack is near 50 percent of the average seasonal peak.

Virgin River Basin Snow Plot.

Soil Moisture:
Below average precipitation during the autumn months created drier soil moisture conditions.

Climate Forecasts:
El Nino climate conditions suggest increased chances of precipitation in this area. The El Nino influence was accounted for in generation of these forecasts.
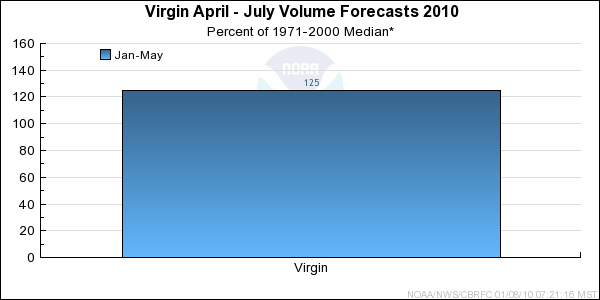
Forecast Summary:
Drier soil moisture conditions tend to reduce forecast volumes. However, the presence of El Nino climate conditions combined with much above average snowpack resulted in April-July forecast volumes between 115 and 135 percent of median.


* Percent usable capacity, not percent average contents.
Click for multi-month Graph.


Virgin Specific Site Forecasts (kaf)

Click site name for graph.
Forecast
Period
90%
Exceedance
Volume
50%
Exceedance
Volume
Percent
Median
10%
Exceedance
Volume
Santa Clara
Pine Valley, Nr April-July1.241338.9
April-July0000
Virgin
Virgin April-July405212792
April-July0000
Hurricane, Nr April-July3353123114
April-July0000
Littlefield April-July2654117117
April-July0000

Differences between the full period forecasts and the residual forecasts may not exactly equal the actual observed volumes due to rounding conventions (see Definitions section).

Precipitation Maps


Definitions

10% exceedance forecast: Given the current hydrometeorological conditions, i.e current snowpack, soil moisture and streamflow, the volume that has a 10% chance of being exceeded. Previously referred to as "Reasonable Maximum Forecast".

50% exceedance forecast: Given the current hydrometeorological conditions, i.e current snowpack, soil moisture and streamflow, the volume that has a 50% chance of being exceeded. Previously referred to as "Most Probable Forecast".

90% exceedance forecast: Given the current hydrometeorological conditions, i.e current snowpack, soil moisture and streamflow, the volume that has a 90% chance of being exceeded. Previously referred to as "Reasonable Minimum Forecast".

Acre-Foot (af): The volume equal to one acre covered one foot deep (43,560 cubic feet). See kaf below.

Average: The arithmetic mean. The sum of the values divided by the number of values. Values from 1971-2000 are used for this publication.

Categories: Much Above Average=Greater than 130%, Above Average=111-130%, Near Average=90-110%, Below Average=70-89%, Much Below Average=Less than 70%.

CBRFC: Colorado Basin River Forecast Center.

Forecast Period: The period from April 1 through July 31, unless otherwise noted.

kaf: Thousand Acre-Feet. See Acre-Foot above.

Inflow: The volume of water that flows into a reservoir or lake.

Median: The middle value of an ordered set of values. Half of the values are higher and half of the values are lower. When the set contains an even number of values the median is the average of the two middle numbers.

NOAA: National Oceanic and Atomospheric Administration.

NWS: National Weather Service.

Rounding Conventions:
RangeRound to
0-1.990.01
2.0-19.90.1
20-1991.0
200-9995.0
1000+3 significant digits


Streamflow: The volume of water that flows past a specific stream site.

Water Year: The 12-month period, October 1 through September 30. The water year is designated by the calendar year in which it ends. Thus, the year ending September 30, 2008, is called the "2008 water year."


Additional Information

Water supply forecasts take into consideration present hydrometeorological conditions and use average basin temperatures and precipitation for the forecast period. As the forecast season progresses, a greater portion of the future hydrologic and climatic uncertainty becomes known and monthly forecasts become more accurate. For more information on the tools we use, consult Water Supply Forecasting Tools.

Volume forecasts represent adjusted flows; that is, observed flows with upstream water use taken into account. Adjusted flows will closely approximate natural or unimpaired flows. However, not all upstream diversions or impoundments are measured or quantifiable. For specific adjustments used with each forecast point, consult the Guide to Water Supply Forecasting.

The Water Supply Outlook is issued monthly January through May by the Colorado Basin River Forecast Center. It represents a coordinated effort between the National Weather Service, Natural Resources Conservation Service, Bureau of Reclamation, U.S. Geological Survey and local water district managers.

Note: Data used in this report are provisional and are subject to revision.

For more information, or to be included on the mailing list, please contact:

Colorado Basin River Forecast Center
2242 W North Temple
Salt Lake City, UT 84116
(801) 524-5130
www.cbrfc.noaa.gov


Hydrologist: G. Smith