The following conditions influenced this month's forecasts:
Precipitation:
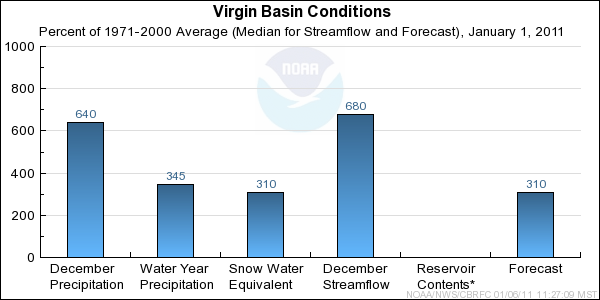
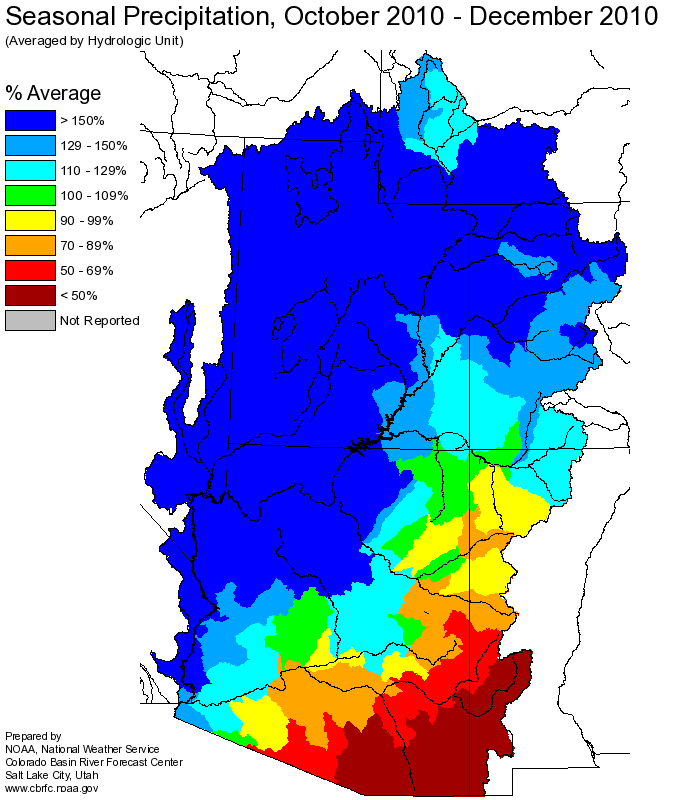
Seasonal October-December
precipitation was near 345 percent of average in the Virgin Headwaters,
and 150 to 465 percent of average basin wide.
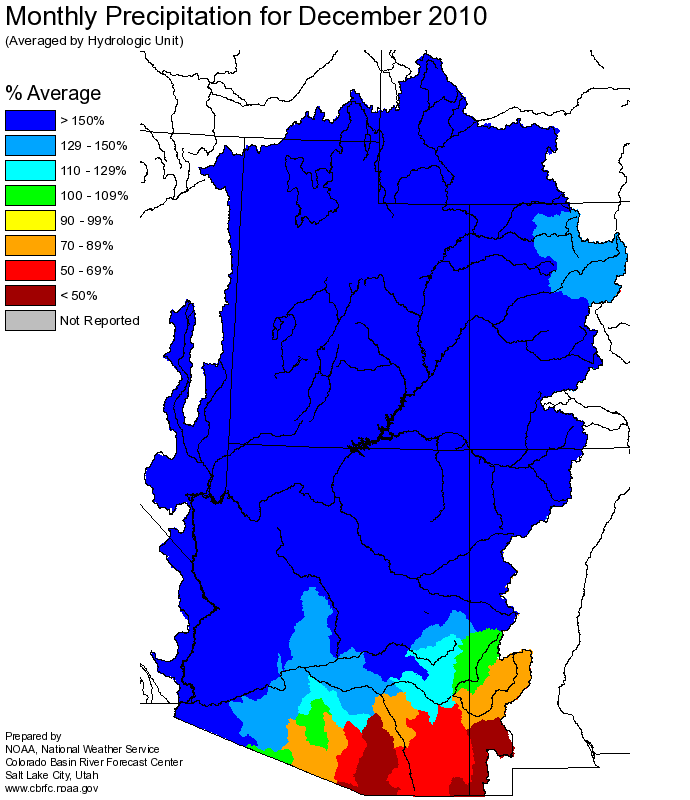
December
precipitation was near 640 percent of average in the Virgin Headwaters, and 170 to 465 percent
of average throughout the remainder of the basin.
Snow:
January 1st snowpack in the Virgin River Basin ranged from 120 to 380 percent of average. At some locations
the snowpack had already reached the average seasonal peak that typically occurs in between mid March and
early April.
Virgin River Basin
Snow Plot.
Streamflow:
December streamflow volumes exceeded 600 percent of average in the Virgin River Basin due to
heavy rainfall received during the last 2 weeks of the month.
Soil Moisture:
Above average soil moisture conditions exist throughout the Virgin River Basin.
Climate Forecasts:
La Nina climate conditions suggest slightly decreased chances of precipitation in this area. The La Nina
influence was considered in generation of these forecasts.
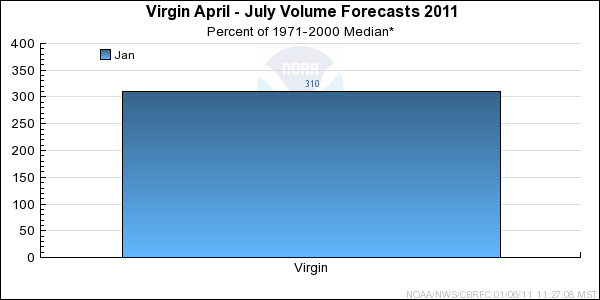
Forecast Summary:
Despite the presence of La Nina climate conditions, the Virgin River basin has experienced above average
precipitation since October. Significant precipitation in October and December resulted in saturated soils
and a large snowpack for early January. As of January 1st April-July runoff volumes are
forecasted to range between 290 to 335 percent of median, or 180 to 195 percent of average.
Differences between the full period forecasts and the residual forecasts may not exactly equal the actual observed volumes due to rounding conventions (see Definitions section).