The following conditions influenced this month's forecasts:
Precipitation:
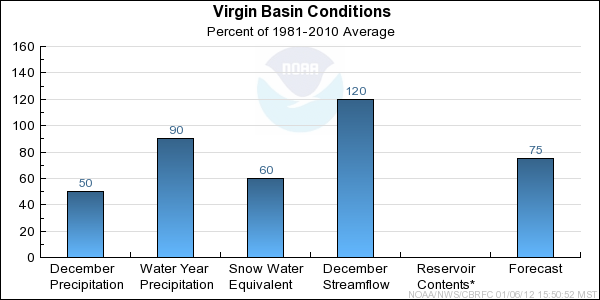
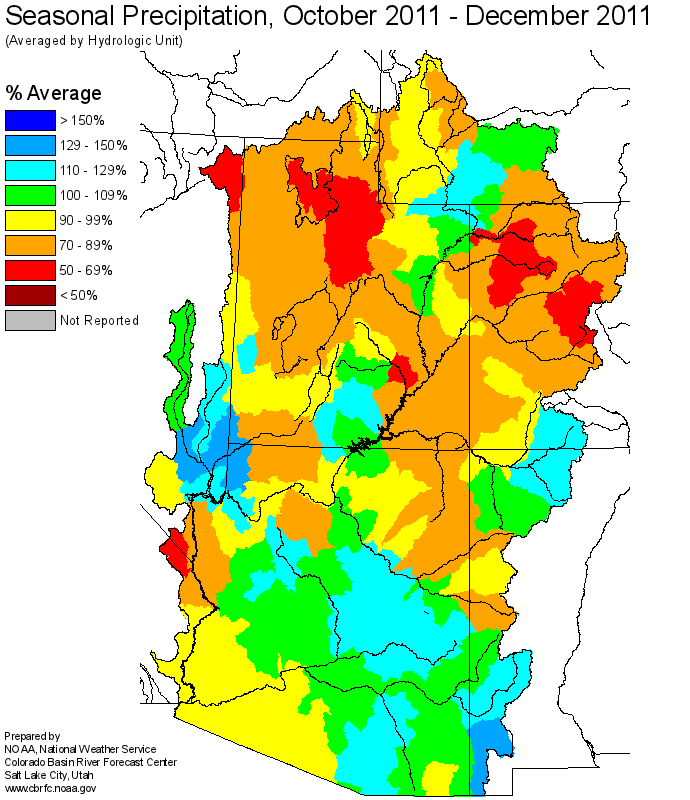
Seasonal October-December
precipitation was near average at 90 percent of average in the Virgin Headwaters.
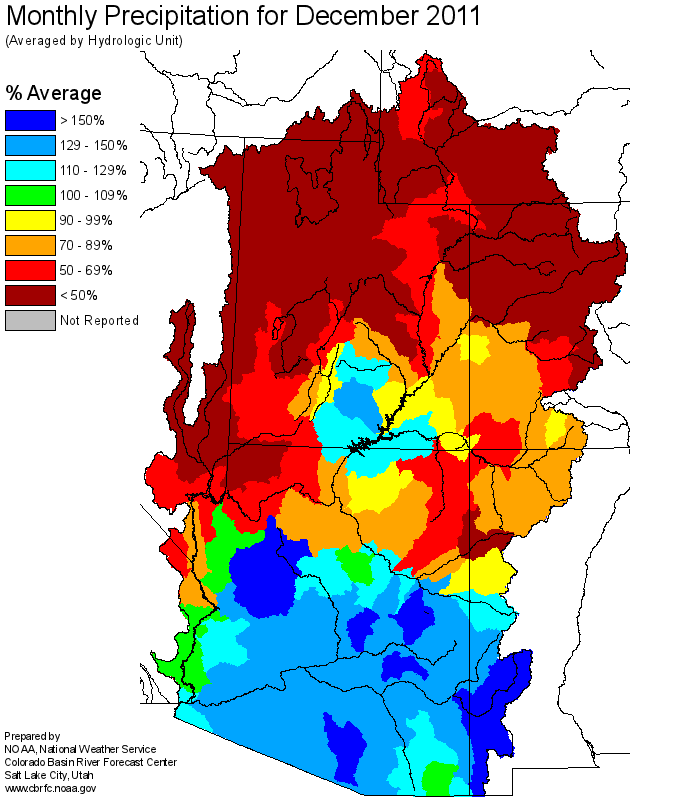
December
precipitation was 50 percent of average in the Virgin Headwaters.
Snow:
January 1st snowpack in the Virgin River Basin was 60 percent of average.
Virgin River Basin
Snow Plot
Streamflow:
December streamflow volume for the Virgin River Basin was 120 percent of average and 130 percent of median.
Soil Moisture:
Soil moisture content was above average going into the winter.
Climate Forecasts:
La Nina climate conditions suggest slightly decreased chances of precipitation in this area.
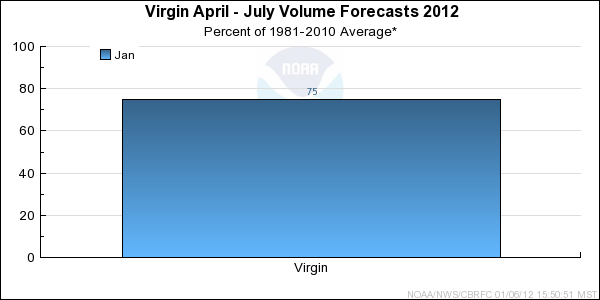
Forecast Summary:
The January 1st snowpack in the Virgin River Basin was 60 percent of average.
Baseflows are running high for this time of year due to higher than average precipitation
received in the basin last winter and spring, as well as elevated soil moisture content for this
time of year. With the near average precipitation received across the Upper Virgin River basin
so far in water year 2012, April-July runoff volumes are forecast to be 70 to 80 percent of average
and 110 to 125 percent of the median and as of January 1st.
However, if a dry weather pattern continues over the next couple of months, the April-July runoff volumes could
easily drop below the median value.
Differences between the full period forecasts and the residual forecasts may not exactly equal the actual observed volumes due to rounding conventions (see Definitions section).