Note: This publication is currently undergoing major revisions. The current publication will be replaced with a new publication based on stakeholder requirements and scientific advances. We expect to begin sharing details on this soon. If you have input on content, format, or publication frequency at any time, please contact us at cbrfc.webmasters@noaa.gov.Virgin Water Supply Outlook, February 1, 2009Virgin Water Supply Outlook, February 1, 2009
Contents
Virgin Summary
Model Soil Moisture/Observed Streamflow - Dry weather in the late summer and fall created below
average soil moisture conditions in the Virgin River Basin heading into the winter season.
Below average streamflow was observed during later fall and early winter. January streamflow was
near average, primarily due to precipitation that combined with some low elevation snow melt
that occurred the last week of January.
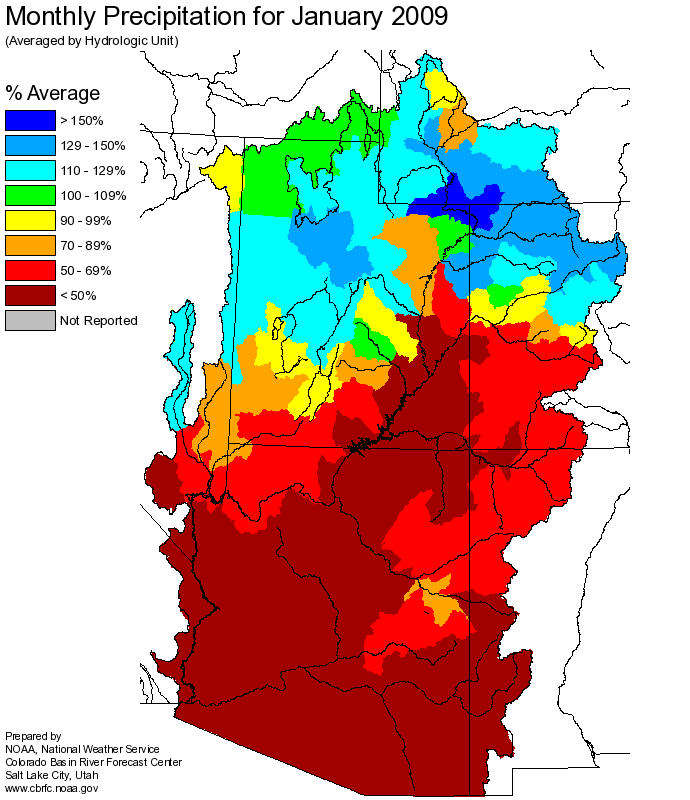
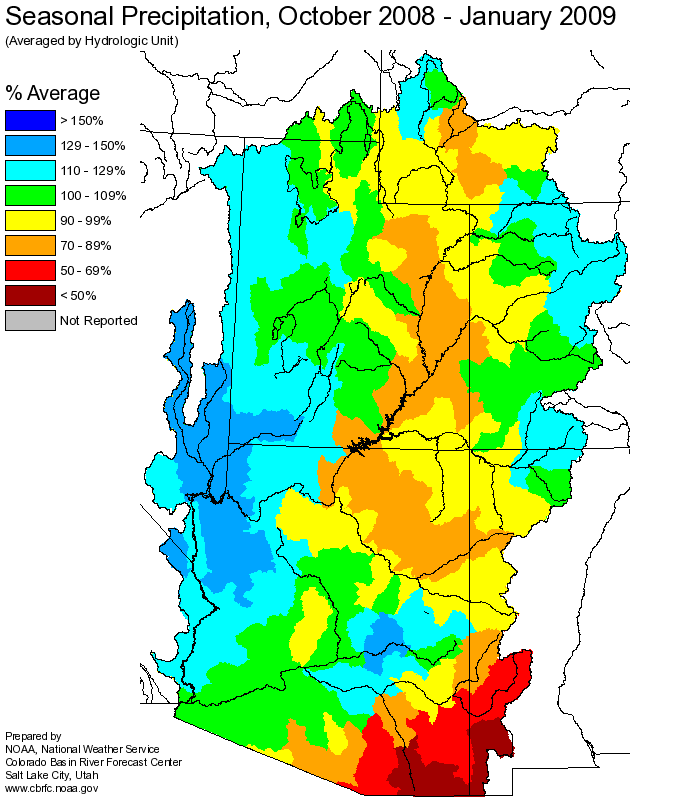
Snowpack/Precipitation - January precipitation ranged from near 40 to 70 percent of average
across the Virgin Basin. Seasonal Oct-Jan precipitation is near 130 percent of average. Snowpack
in the Virgin Basin ranges from 110 to 160 percent of average as of February 1st. Snowpack
also ranges from 55 to 100 percent of the seasonal peak. Peak snowpack typically occurs between
mid March and early April at higher elevations.
General Discussion/Forecasts - The 90 day Climate Prediction Center (CPC) forecast valid for the Feb-Mar time
period suggests above average temperatures and equal chances of both above or below average precipitation
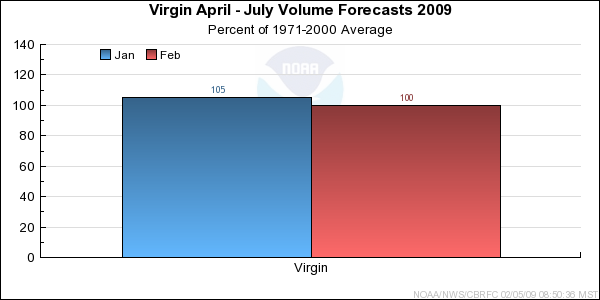
in the Virgin River Basin. April-July runoff volumes are expected to be near average in the Virgin River
Basin. Seasonal runoff volumes in the Virgin Basin will be very dependent upon additional snowfall over the
next month and springtime precipitation.
*Median of forecasts within each basin.
Virgin Basin Conditions
Apr-Jul runoff volumes in the Virgin River Basin are expected to range from near 95 to 100 percent
of the average.

* Percent usable capacity, not percent average contents.
Click for multi-month Graph.
Differences between the full period forecasts and the residual forecasts may not exactly equal the actual observed volumes due to rounding conventions (see Definitions section).
Precipitation Maps
Hydrologist: G. Smith
