The following conditions influenced this month's forecasts:
Precipitation:
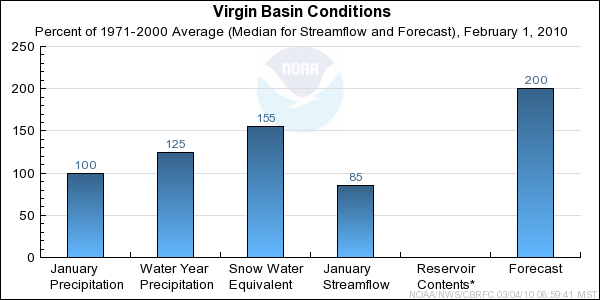
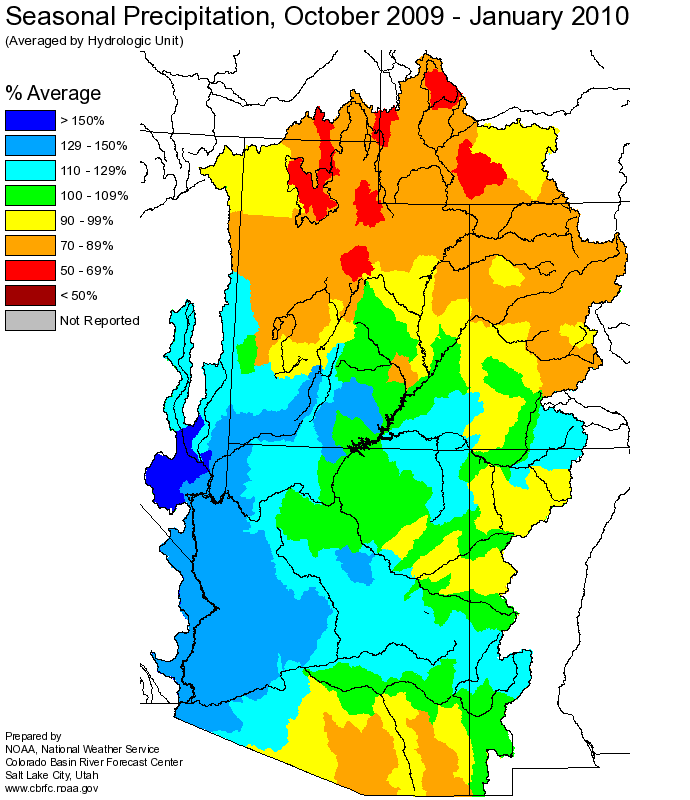
Seasonal October-January
precipitation is near 130
percent of average in the Virgin Headwaters, and ranges from 120 to 160 percent of average basin wide.
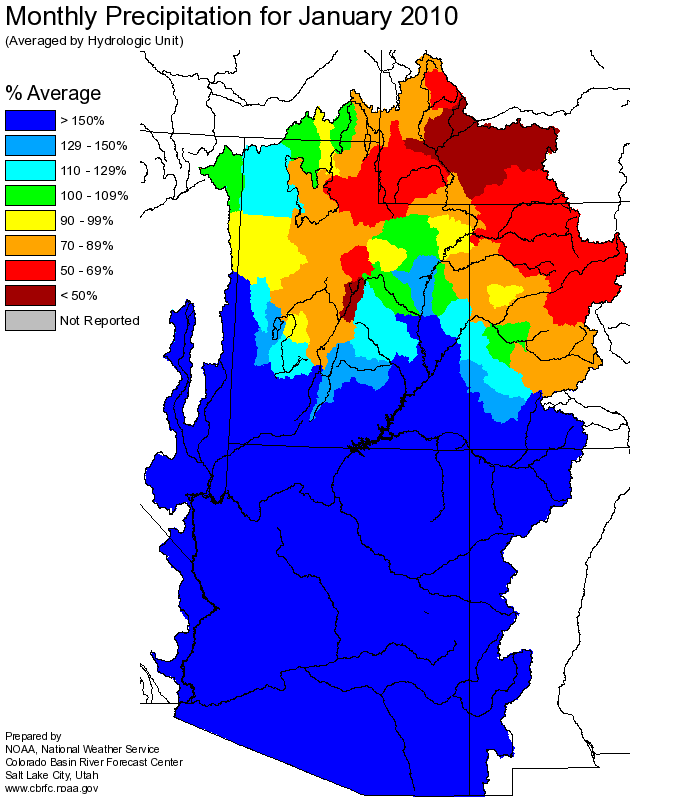
January
precipitation was near 200 percent of average in the Virgin Headwaters, and 190 to 350 percent of average
throughout the remainder of the basin.
Snow:
Snowpack increased across higher elevations of the Virgin River Basin during January. As of
February 1st snowpack, expressed as water equivalent contained in the snow, ranged from 140 to
260 percent of average.
Virgin River Basin
Snow Plot.
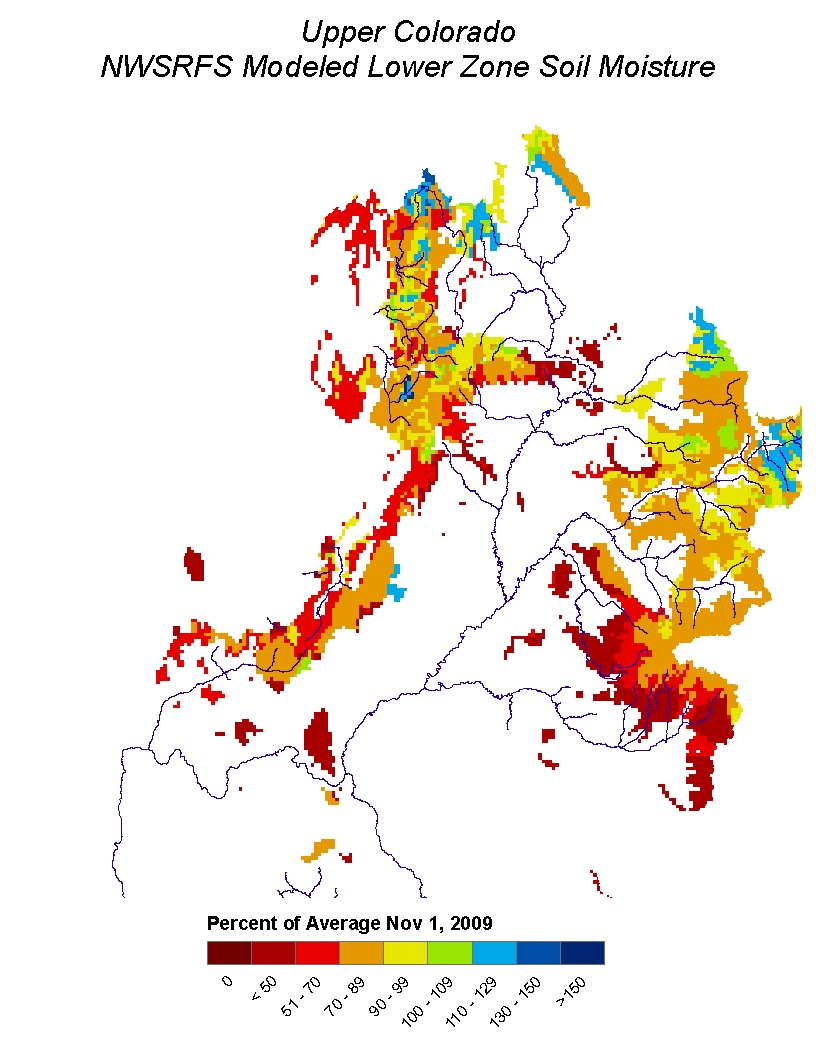
Soil Moisture:
Below average modeled
soil moisture conditions existed entering the winter season. Below
average soil moisture conditions still exist at higher elevations where snowpack has persisted throughout the winter.
Climate Forecasts:
El Nino climate conditions suggest increased chances of precipitation in this area. The El Nino
influence was accounted for in generation of these forecasts.
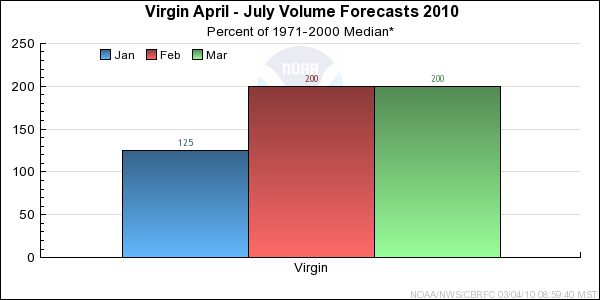
Forecast Summary:
Drier soil moisture conditions tend to reduce forecast volumes. However, above average precipitation is
anticipated over the next couple of months due to the presence of El Nino climate conditions. This combined with
much above average snowpack has resulted in an increase in
forecasted runoff volumes from those issued in January.
April-July runoff volumes are expected to be near 200 percent of median, which is 125 percent of average.
Differences between the full period forecasts and the residual forecasts may not exactly equal the actual observed volumes due to rounding conventions (see Definitions section).
