The following conditions influenced this month's forecasts:
Precipitation:
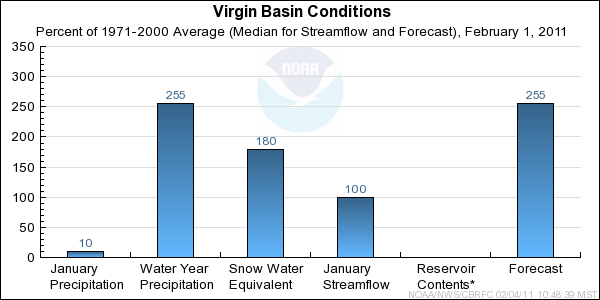
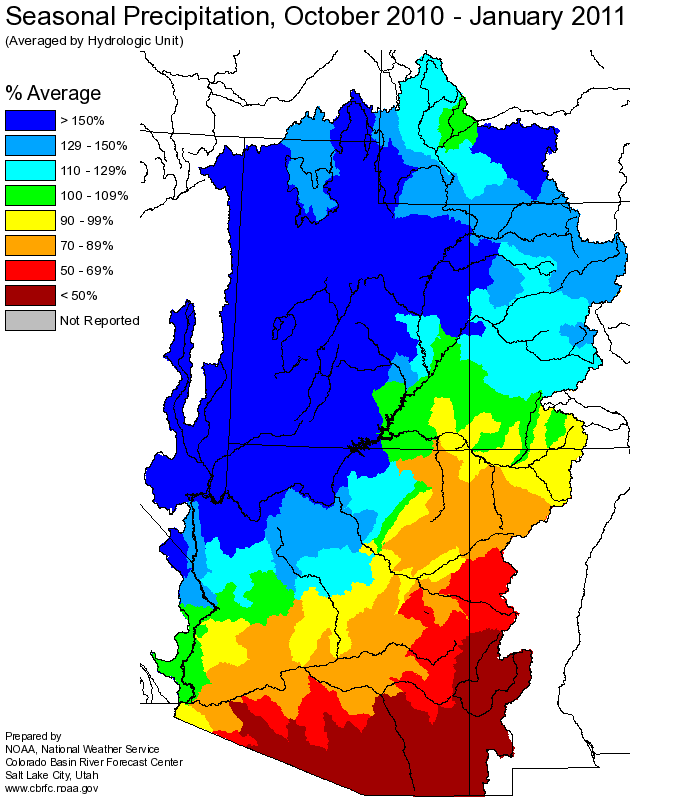
Seasonal October-January
precipitation was
near 255 percent of average in the Virgin Basin headwaters, and 130 to 280 percent of average basin wide.
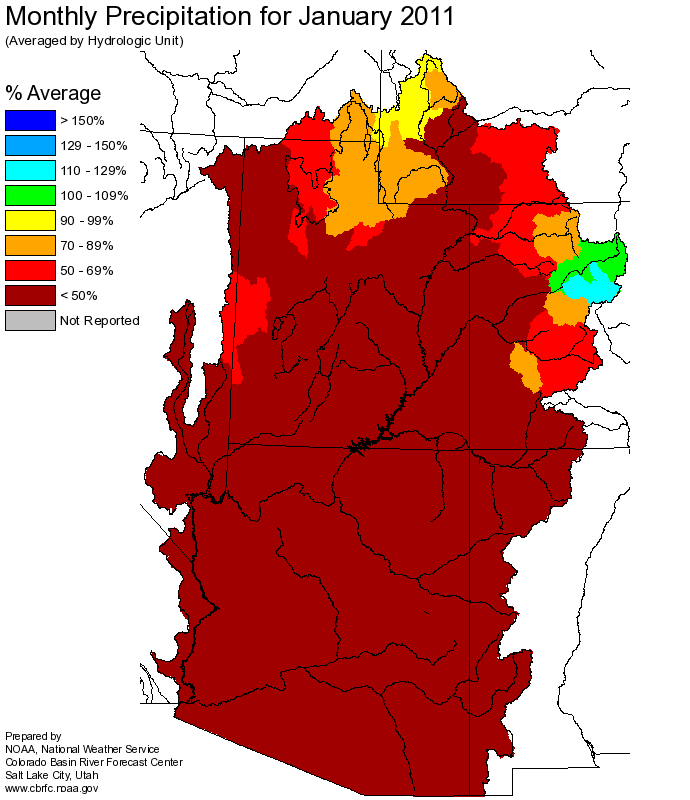
January
precipitation was near 10 percent of average in the Virgin Basin headwaters, and 5 to 35 percent
of average throughout the remainder of the basin.
Snow:
February 1st snowpack in the Virgin River Basin ranged from 150 to 215 percent of average at elevations above 7500 feet. Above
average temperatures and dry conditions in January allowed most lower elevation snow to melt off.
Virgin River Basin
Snow Plot.
Streamflow:
January streamflow volumes were near the 1971-2000 median on the Virgin Basin headwaters.
Soil Moisture:
Above average soil moisture conditions exist throughout the Virgin River Basin.
Climate Forecasts:
La Nina climate conditions suggest slightly decreased chances of precipitation in this area. The La Nina
influence was considered in generation of these forecasts.
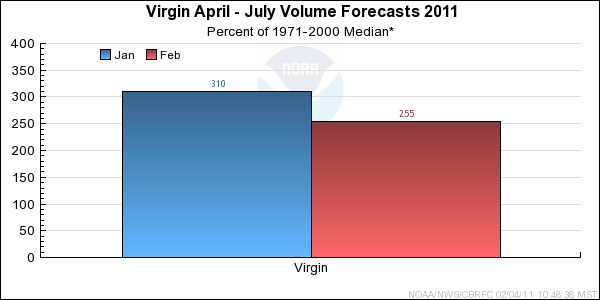
Forecast Summary:
Significant precipitation in October and December resulted in above average soil moisture conditions and
a high elevation snowpack that has exceeded the seasonal peak, which typically occurs in
late March or early April. Dry conditions in January, more typical of existing La Nina climate
conditions, resulted in decreased April-July runoff forecasts. Above median volumes are still
anticipated at this time, however continued dry conditions may result in further decreases to
forecast volumes. As of Februay 1st April-July runoff volumes are forecasted to range between 245 to 260 percent
of median, or 145 to 160 percent of average.
Differences between the full period forecasts and the residual forecasts may not exactly equal the actual observed volumes due to rounding conventions (see Definitions section).