The following conditions influenced this month's forecasts:
Precipitation:
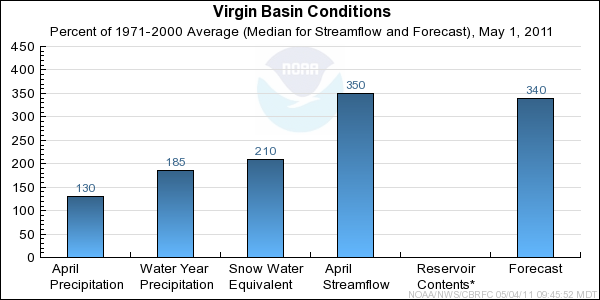
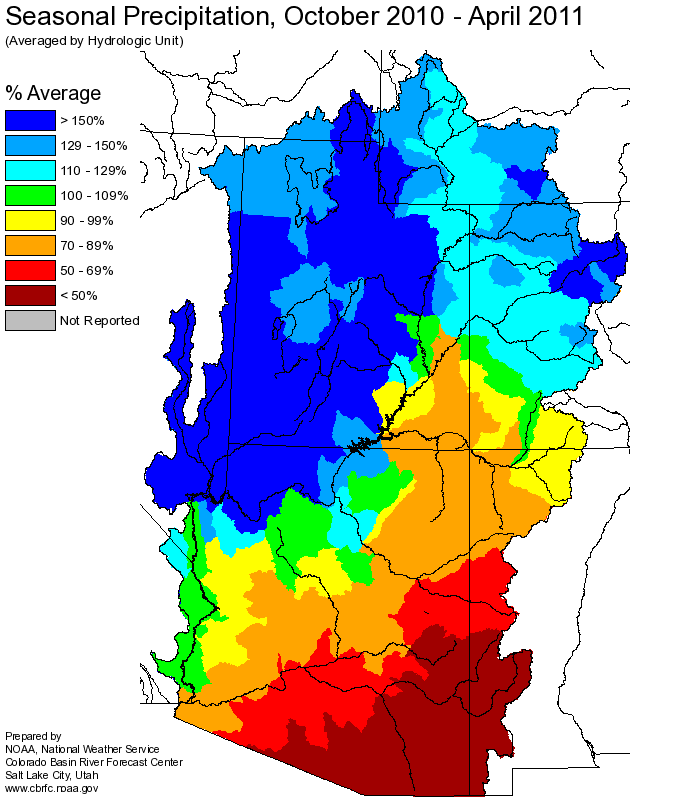
Seasonal October-April
precipitation was
near 185 percent of average in the Virgin Basin headwaters.
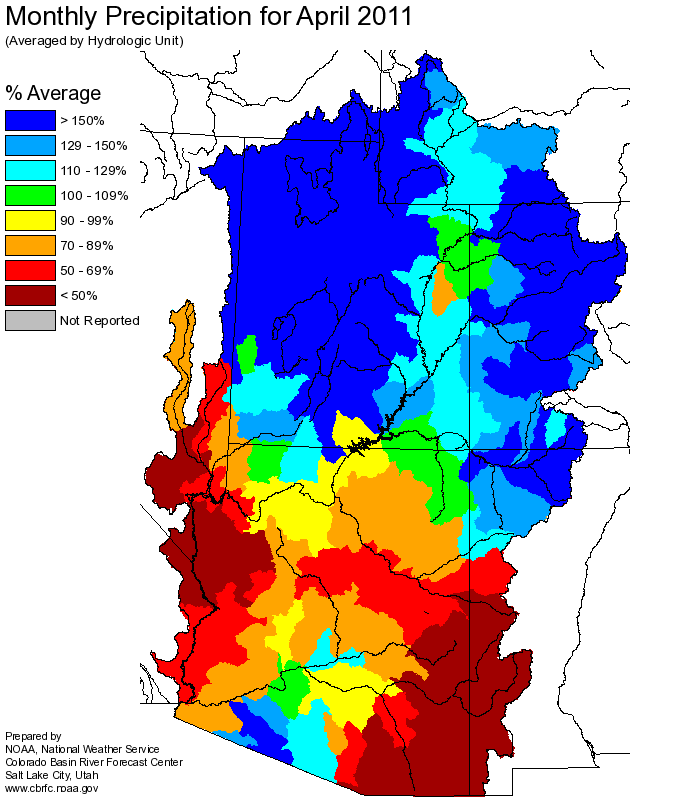
April
precipitation was near 130 percent of average in the Virgin Basin Headwaters.
Snow:
May 1st snowpack in the Virgin River Basin varies significantly. Lowest elevations have melted out which is typical
for this time of year. In highest elevations a significant snowpack remains, and ranges from 190 to 350 percent
of average.
Virgin River Basin
Snow Plot.
Streamflow:
April streamflow volumes in the Virgin headwaters were near 315 percent the 1971-2000 median while
volumes on the Santa Clara River were near 205% of median.
Soil Moisture:
Above average soil moisture conditions exist throughout the Virgin River Basin.
Climate Forecasts:
La Nina climate conditions have existed throughout the winter months, but have been weakening and are expected
to dissipate by late spring or early summer. La Nina conditions were considered earlier in the season when
generating forecasts and were less influential as the season progressed.
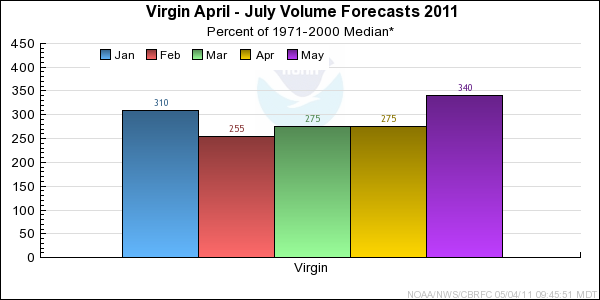
Forecast Summary:
Above average precipitation during April in the Virgin River Basin, snowmelt at lower elevations, and
above average soil moisture conditions combined to produce April runoff volumes that ranged from 200 to 350 percent
of median (215-270% of average). Snowpack at the highest elevations ranges from 190 to 350 percent of average
for May 1st. Runoff during the May-July period is expected to range from 340 to 400 percent of median
or 180 to 210 percent of average.
Full period April-July volumes are forecast to range between 330 to 350 percent of median, or 185 to 220
percent of average.
Differences between the full period forecasts and the residual forecasts may not exactly equal the actual observed volumes due to rounding conventions (see Definitions section).