The following conditions influenced this month's forecasts:
Precipitation:
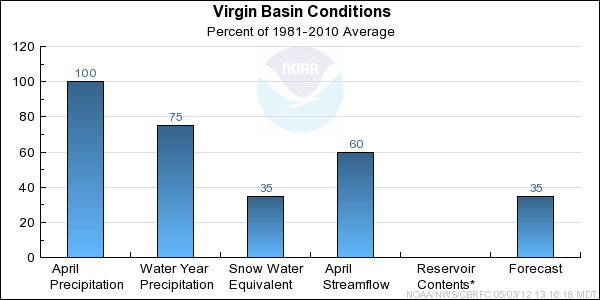
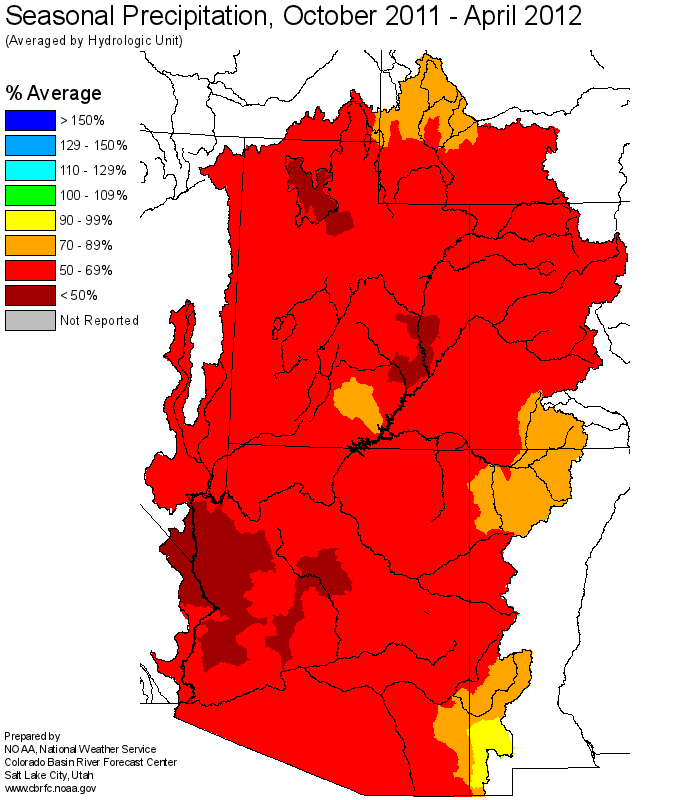
Seasonal October-April
precipitation was below average at 75 percent of average in the Virgin Headwaters.
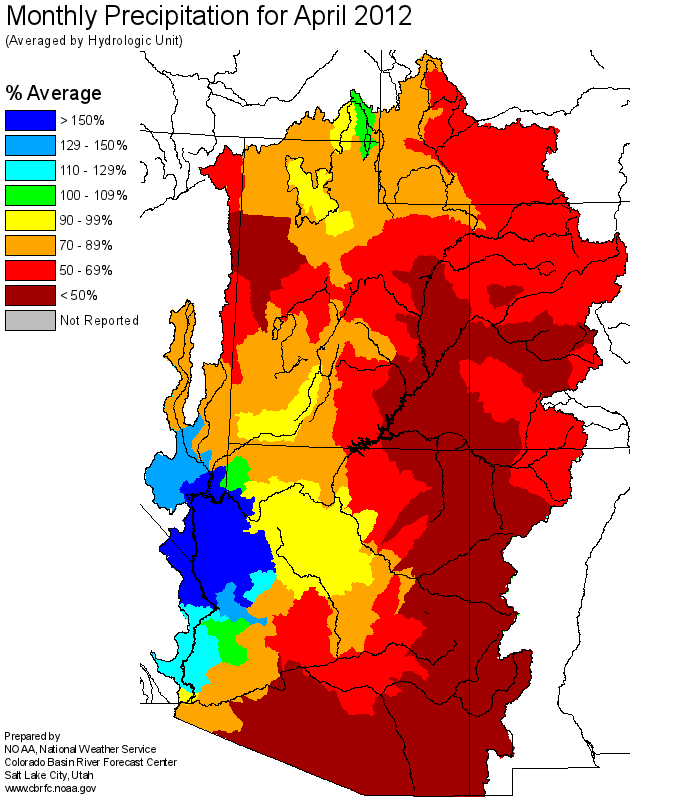
April
precipitation was average at 100 percent of average in the Virgin Headwaters.
Snow:
May 1st snowpack in the Virgin River Basin was 35 percent of average.
Virgin River Basin
Snow Plot
Streamflow:
April streamflow volume for the Virgin River Basin was 60 percent of average and 70 percent of median.
Soil Moisture:
Modeled
soil moisture content was above average in the Virgin River Headwaters going into the winter.
Climate Forecasts:
Conditions are expected to transition from La Nina to neutral as summer approaches. La Nina/El Nino was not factored into this month's forecasts.
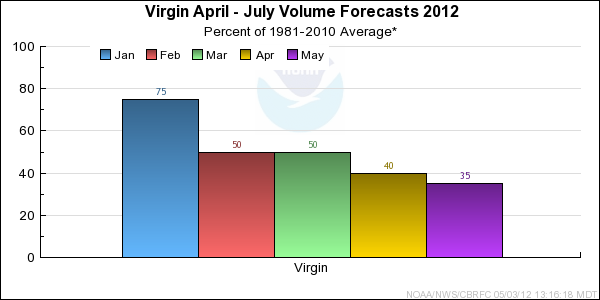
Forecast Summary:
Above average temperatures persisted into April and melted most of the remaining snowpack in southwestern Utah.
The May 1 snowpack continues to be much below average at 35 percent of average. Snow exists only at the highest elevations.
April streamflow was also much below average, at 60 percent of average.
Runoff during the May-July period is expected to range from 28 to 37 percent of average and 50 to 58 percent of median.
Full period April-July volumes are forecast to range between 33 and 45 percent of average and 51 to 63 percent of median.
Differences between the full period forecasts and the residual forecasts may not exactly equal the actual observed volumes due to rounding conventions (see Definitions section).