The following conditions influenced this month's forecasts:
Precipitation:
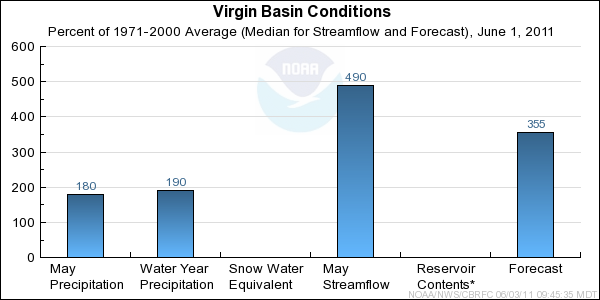
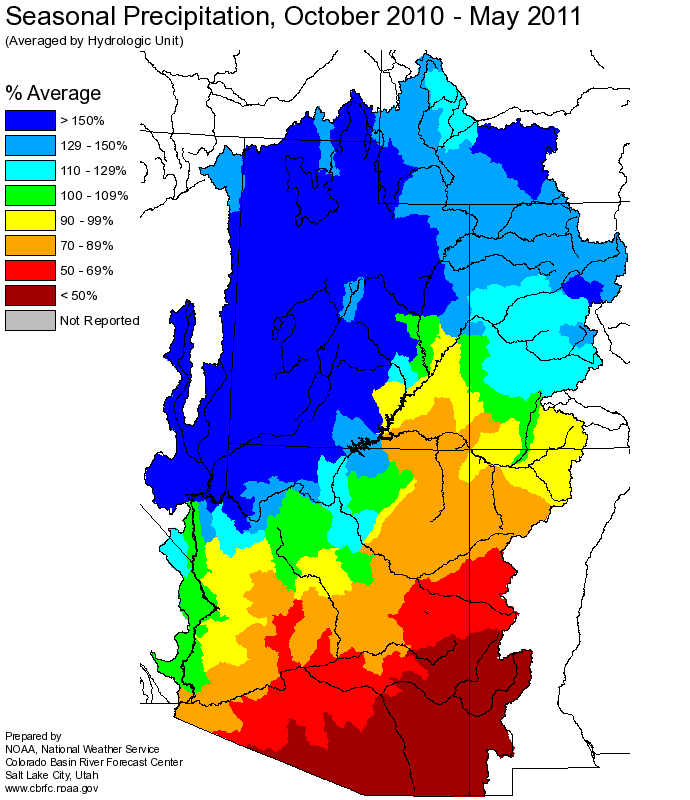
Seasonal October-May
precipitation was
near 190 percent of average in the Virgin Basin headwaters.
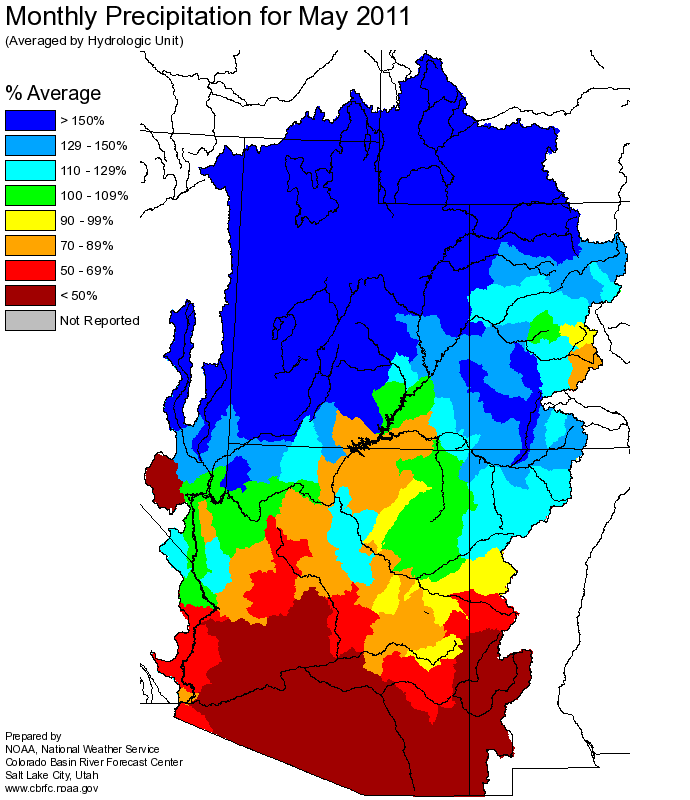
May
precipitation was near 180 percent of average in the Virgin Basin Headwaters.
Snow:
The snow has melted out of most areas below 9000 feet. Sheltered areas and highest elevations within the
Virgin River Basin still contain several inches of water content in the snowpack. Peak snow water
equivalent amounts are in the 20 to 30 inch range.
Virgin River Basin
Snow Plot.
Streamflow:
May streamflow volumes on the Virgin River were near 490 percent the 1971-2000 median while
volumes on the Santa Clara River were near 280% of median.
Soil Moisture:
Above average soil moisture conditions exist throughout the Virgin River Basin.
Climate Forecasts:
La Nina climate conditions existed throughout the winter months, and were considered in early season forecasts.
La Nina climate conditions became less influential in forecasts as the season progressed.
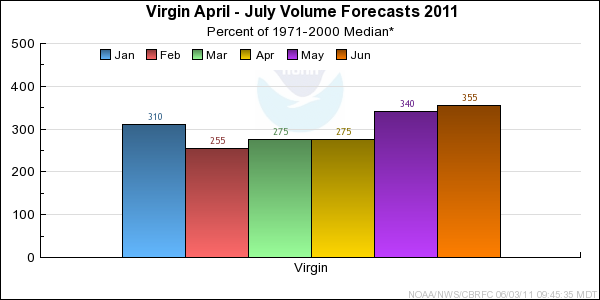
Forecast Summary:
Snowmelt during May combined with above average precipitation resulted in significant streamflow
volumes for the month. Volumes exceeded 270 percent of median (170 percent of average) on the Santa Clara
River and 450 percent of median (240 percent of average) on the Virgin River. Significant snow remains
at highest sheltered elevations and will continue to contribute to above median runoff volumes during
the June-July period. June-July streamflow volummes are expected to range from 300 to 600 percent of
median or 200 to 240 percent of average.
Full period April-July volumes are forecast to range between 350 to 380 percent of median, or 190 to 240
percent of average.
Differences between the full period forecasts and the residual forecasts may not exactly equal the actual observed volumes due to rounding conventions (see Definitions section).