The following conditions influenced this month's forecasts:
Precipitation:
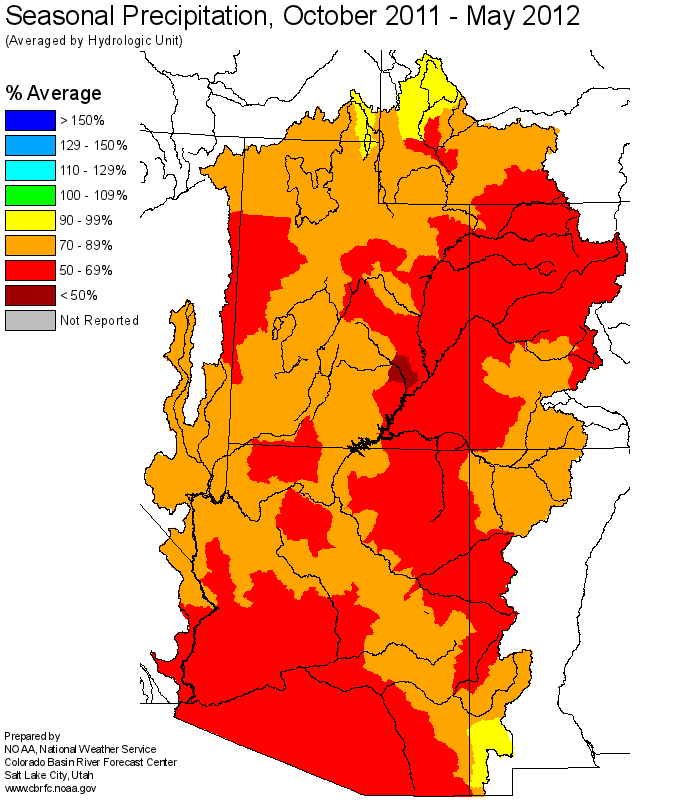
Seasonal October-May
precipitation was below average at 70 percent of average in the Virgin Headwaters.
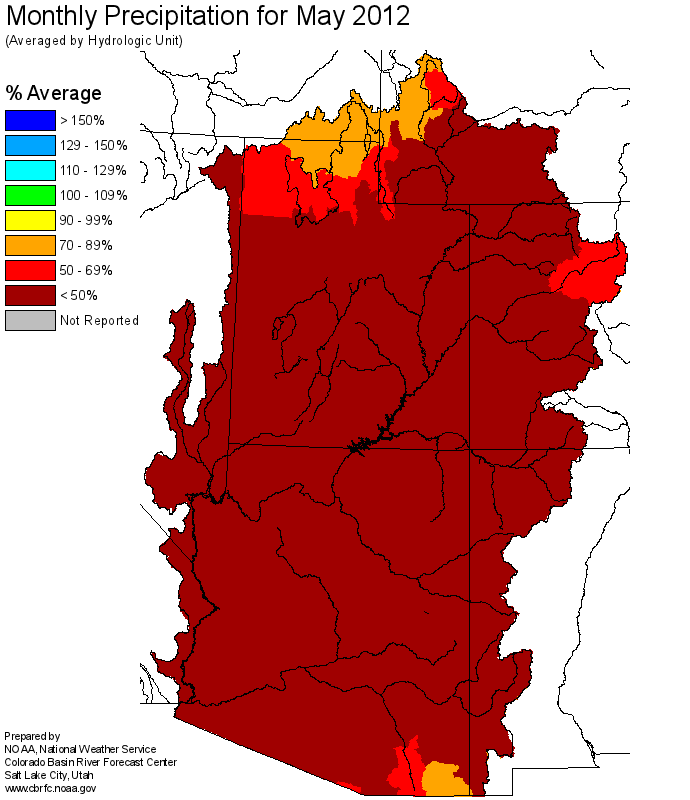
May
precipitation was much below average at 5 percent of average in the Virgin Headwaters.
Snow:
The remaining portions of the snowpack melted out in May in the Virgin River basin, and the snowpack is gone as of June 1st in the Virgin River Basin.
Virgin River Basin
Snow Plot
Streamflow:
May streamflow volume dropped from April in terms of percent of average and median. The May streamflow volume for the Virgin River basin was 30 percent of average and 50 percent of median.
Soil Moisture:
Modeled
soil moisture content was above average in the Virgin River Headwaters going into the winter.
Climate Forecasts:
Conditions have transitioned from La Nina to neutral. La Nina/El Nino was not factored into this month's forecasts.
Forecast Summary:
The limited snowpack melted out in May, even at high elevations of the Virgin River Basin. May was very dry, with the monthly precipitation being much below average, at 5 percent of average. May streamflows were also much below average, at 30 percent of average.
Runoff during the June-July period is expected to range from 19 to 46 percent of average and 47 to 66 percent of median.
Full period April-July volumes are forecast to range between 32 and 43 percent of average and 49 to 63 percent of median.
Differences between the full period forecasts and the residual forecasts may not exactly equal the actual observed volumes due to rounding conventions (see Definitions section).