
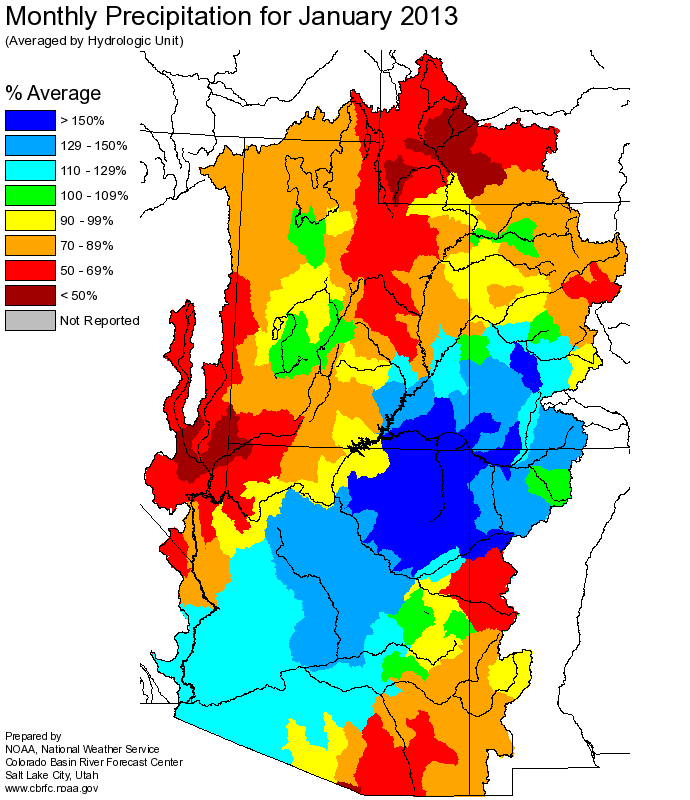
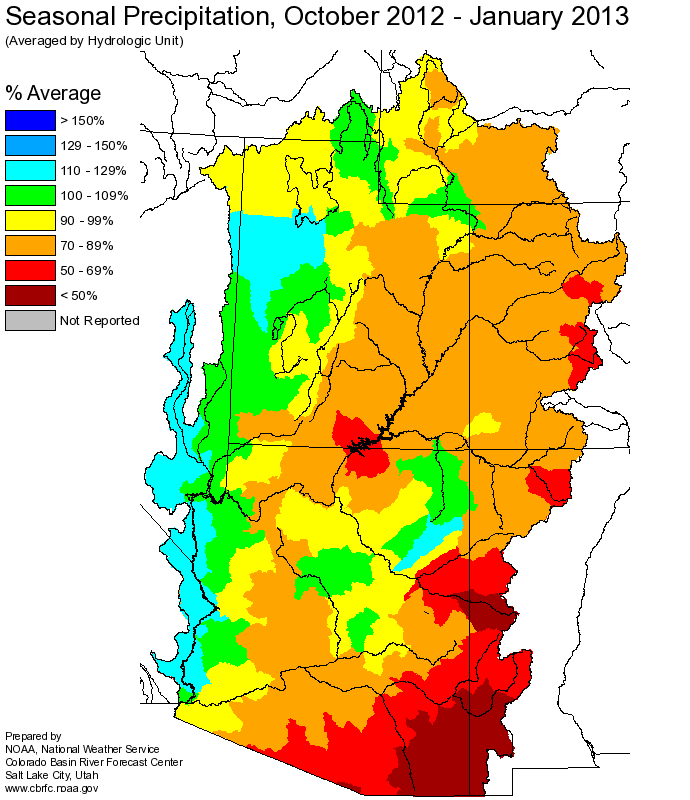
NOAA, National Weather Service
Colorado Basin River Forecast Center
Salt Lake City, Utah
www.cbrfc.noaa.gov
| Prepared by Ashley Nielson NOAA, National Weather Service Colorado Basin River Forecast Center Salt Lake City, Utah www.cbrfc.noaa.gov |

| Forecast Period | 90% Exceedance Volume | 50% Exceedance Volume | Percent Average | 10% Exceedance Volume | |||
| Green | |||||||
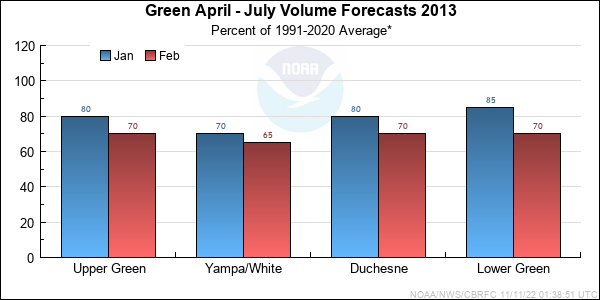
| Daniel, Nr, Warren Bridge, At | April-July | 134 | 200 | 82 | 275 | ||
| Pine Ck | |||||||
| Fremont Lk, Abv | April-July | 58 | 80 | 82 | 104 | ||
| New Fork | |||||||
| Big Piney, Nr | April-July | 152 | 255 | 72 | 400 | ||
| Green | |||||||
| Fontenelle Res, Fontenelle Nr | April-July | 290 | 495 | 68 | 775 | ||
| Big Sandy | |||||||
| Farson, Nr | April-July | 24 | 37 | 71 | 60 | ||
| Green | |||||||
| Green River, Wy, Nr | April-July | 280 | 480 | 66 | 805 | ||
| Hams Fork | |||||||
| Frontier, Nr, Pole Ck, Blo | April-July | 28 | 40 | 74 | 71 | ||
| Viva Naughton Res | April-July | 37 | 53 | 72 | 105 | ||
| Blacks Fork | |||||||
| Robertson, Nr | April-July | 41 | 66 | 74 | 106 | ||
| Ef Smiths Fork | |||||||
| Stateline Res, Robertson,nr | April-July | 12.9 | 18.5 | 71 | 27 | ||
| Green | |||||||
| Flaming Gorge Res, Flaming Gorge Dam, At | April-July | 350 | 640 | 65 | 1250 |
| Forecast Period | 90% Exceedance Volume | 50% Exceedance Volume | Percent Average | 10% Exceedance Volume | |||
| Yampa | |||||||
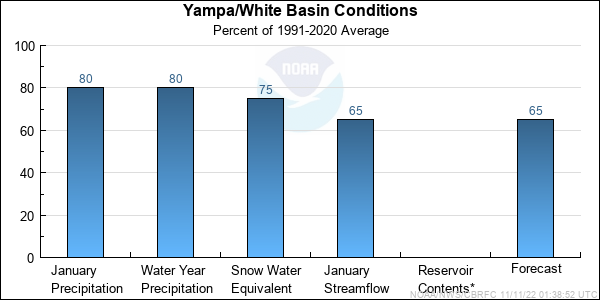
| Stagecoach Rsvr, Abv | April-July | 9.8 | 16.2 | 70 | 23 | ||
| Steamboat Springs | April-July | 110 | 172 | 66 | 245 | ||
| Elk | |||||||
| Milner, Nr | April-July | 146 | 215 | 67 | 310 | ||
| Elkhead Ck | |||||||
| Long Gulch, Abv, Hayden, Nr | April-July | 21 | 45 | 62 | 63 | ||
| Yampa | |||||||
| Maybell, Nr | April-July | 335 | 590 | 63 | 900 | ||
| Little Snake | |||||||
| Slater, Nr | April-July | 61 | 95 | 61 | 149 | ||
| Savery, Nr | April-July | 100 | 182 | 53 | 310 | ||
| Lily, Nr | April-July | 102 | 185 | 54 | 320 | ||
| White | |||||||
| Meeker, Nr | April-July | 100 | 176 | 63 | 270 | ||
| Watson, Nr | April-July | 97 | 180 | 64 | 290 |
| Forecast Period | 90% Exceedance Volume | 50% Exceedance Volume | Percent Average | 10% Exceedance Volume | |||
| Big Brush Ck | |||||||
| Vernal, Nr, Red Fleet Res, Abv | April-July | 10 | 13.9 | 66 | 23 | ||
| Ashley Ck | |||||||
| Vernal, Nr | April-July | 22 | 34 | 68 | 58 | ||
| West Fork Duchesne | |||||||
| Vat Diversion, Blo | April-July | 9.3 | 13.5 | 73 | 21 | ||
| Duchesne | |||||||
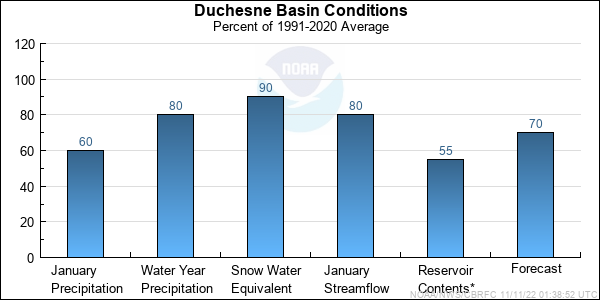
| Tabiona, Nr | April-July | 49 | 80 | 74 | 114 | ||
| Rock Ck | |||||||
| Upper Stillwater Res | April-July | 39 | 52 | 70 | 82 | ||
| South Fork Rock Ck | |||||||
| Docs Div, Blo | April-July | 3.4 | 5 | 68 | 7.8 | ||
| Rock Ck | |||||||
| Mountain Home, Nr | April-July | 48 | 63 | 72 | 100 | ||
| Currant Ck | |||||||
| Currant Ck Res | April-July | 5.7 | 13.6 | 68 | 23 | ||
| Strawberry | |||||||
| Solider Springs,nr | April-July | 19.3 | 40 | 73 | 65 | ||
| Starvation Res, Duchesne, Nr | April-July | 44 | 80 | 71 | 133 | ||
| Duchesne | |||||||
| Duchesne, Nr, Knight Div, Abv | April-July | 96 | 141 | 73 | 205 | ||
| Lake Fork | |||||||
| Moon Lake Res, Mtn Home, Nr | April-July | 31 | 47 | 71 | 71 | ||
| Yellowstone | |||||||
| Altonah, Nr | April-July | 29 | 41 | 67 | 65 | ||
| Whiterocks | |||||||
| Whiterocks, Nr | April-July | 25 | 38 | 70 | 61 | ||
| Uinta | |||||||
| Neola, Nr | April-July | 32 | 50 | 68 | 81 | ||
| Duchesne | |||||||
| Myton | April-July | 83 | 205 | 62 | 350 | ||
| Randlett, Nr | April-July | 88 | 225 | 58 | 420 |
| Forecast Period | 90% Exceedance Volume | 50% Exceedance Volume | Percent Average | 10% Exceedance Volume | |||
| White | |||||||
| Blo Tabbyune Ck, Soldier Summit, Nr | April-July | 5.7 | 11.4 | 74 | 17.2 | ||
| Fish Ck | |||||||
| Scofield, Nr, Reservoir, Abv | April-July | 17.4 | 23 | 77 | 34 | ||
| Price | |||||||
| Scofield Res, Scofield, Nr | April-July | 23 | 31 | 76 | 47 | ||
| Green | |||||||
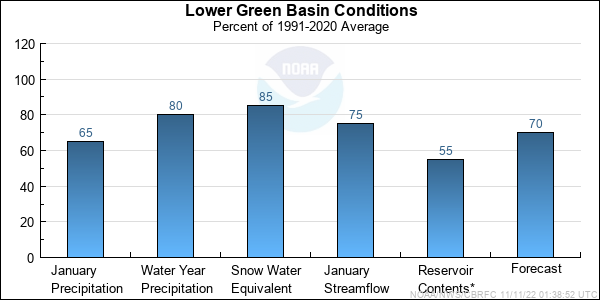
| Green River, Ut | April-July | 1070 | 1780 | 60 | 3130 | ||
| Huntington Ck | |||||||
| Electric Lake | April-July | 5.4 | 9.1 | 68 | 17.5 | ||
| Power Plant, Blo | April-July | 22 | 31 | 78 | 49 | ||
| Seeley Ck | |||||||
| Joes Vly Res, Orangeville, Nr | April-July | 22 | 37 | 66 | 57 | ||
| Ferron Ck | |||||||
| Ferron, Nr | April-July | 12.8 | 27 | 71 | 41 | ||
| Muddy Ck | |||||||
| Emery, Nr | April-July | 8.7 | 13.5 | 68 | 22 |
| EOM Contents | Percent EOM Average | Percent Usable Capacity | Last Year EOM | Last Year %Average | EOM Average | Usable Capacity | |
|
| |||||||
| Fontenelle Res, Fontenelle Nr | 165.8 | 110 | 48 | 164.8 | 110 | 150.1 | 344.8 |
|
| |||||||
| Big Sandy Res, Farson, Nr | 7.2 | 43 | 19 | 22.1 | 133 | 16.6 | 38.3 |
| Blacks Fork | |||||||
| Meeks Cabin | 6.9 | 59 | 23 | 16.4 | 142 | 11.5 | 29.9 |
|
| |||||||
| Stateline Res, Robertson,nr | 4.6 | 82 | 33 | 6.8 | 122 | 5.6 | 13.9 |
|
| |||||||
| Flaming Gorge Res, Flaming Gorge Dam, At | 2980.7 | 98 | 80 | 3343.2 | 110 | 3050.5 | 3749.0 |
|
| |||||||
| Solider Springs,nr | 897.0 | 122 | 81 | 972.7 | 132 | 735.5 | 1105.9 |
| Starvation Res, Duchesne, Nr | 135.6 | 98 | 82 | 153.6 | 111 | 138.8 | 165.3 |
|
| |||||||
| Upper Stillwater Res | 9.5 | 110 | 30 | 9.4 | 109 | 8.6 | 31.4 |
|
| |||||||
| Moon Lake Res, Mtn Home, Nr | 9.5 | 39 | 26 | 22.2 | 91 | 24.4 | 36.5 |
|
| |||||||
| Red Fleet Res, Vernal, Nr | 13.9 | 77 | 54 | 21.1 | 117 | 18.0 | 25.7 |
|
| |||||||
| Scofield Res, Scofield, Nr | 28.0 | 94 | 42 | 50.5 | 169 | 29.9 | 65.8 |
|
| |||||||
| Joes Vly Res, Orangeville, Nr | 33.6 | 86 | 54 | 47.5 | 121 | 39.3 | 62.5 |
|
| |||||||
| Electric Lake | 19.4 | 101 | 62 | 25.3 | 132 | 19.2 | 31.5 |
|
| |||||||
| TOTAL | 4311.5 | 101 | 76 | 4855.5 | 114 | 4247.9 | 5700.4 |
| Range | Round to | |
| 0-1.99 | 0.01 | |
| 2.0-19.9 | 0.1 | |
| 20-199 | 1.0 | |
| 200-999 | 5.0 | |
| 1000+ | 3 significant digits |