Green Water Supply Outlook, June 1, 2013
Note:
This publication is scheduled for revision. If you have feedback on content, format, or publication frequency, please
contact us
.
Prepared by
Ashley Nielson
NOAA, National Weather Service
Colorado Basin River Forecast Center
Salt Lake City, Utah
www.cbrfc.noaa.gov
Contents
Upper Green Basin Conditions
Yampa/White Basin Conditions
Duchesne Basin Conditions
Lower Green Basin Conditions
Upper Green Specific Site Forecasts
Yampa/White Specific Site Forecasts
Duchesne Specific Site Forecasts
Lower Green Specific Site Forecasts
Reservoir Contents
Precipitation Maps
Definitions
Additional Information
Questions or Comments
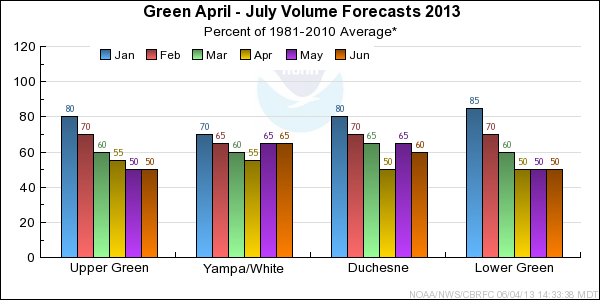
Green Summary
*Median of forecasts within each basin.
Upper Green Basin Conditions
* Percent usable capacity, not percent average contents.
Click for multi-month Graph.
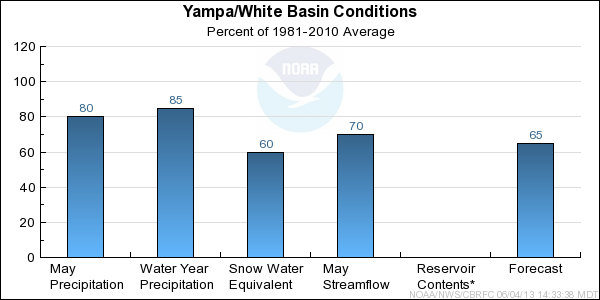
Yampa/White Basin Conditions
* Percent usable capacity, not percent average contents.
Click for multi-month Graph.
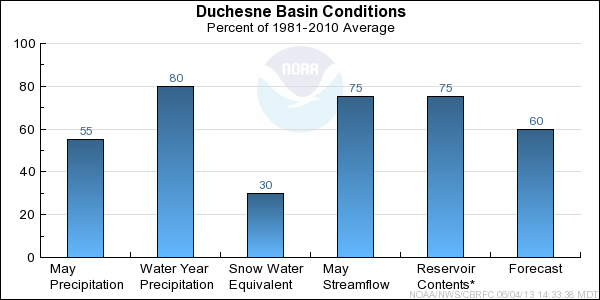
Duchesne Basin Conditions
* Percent usable capacity, not percent average contents.
Click for multi-month Graph.
Lower Green Basin Conditions
* Percent usable capacity, not percent average contents.
Click for multi-month Graph.
Differences between the full period forecasts and the residual forecasts may not exactly equal the actual observed volumes due to rounding conventions (see Definitions section).
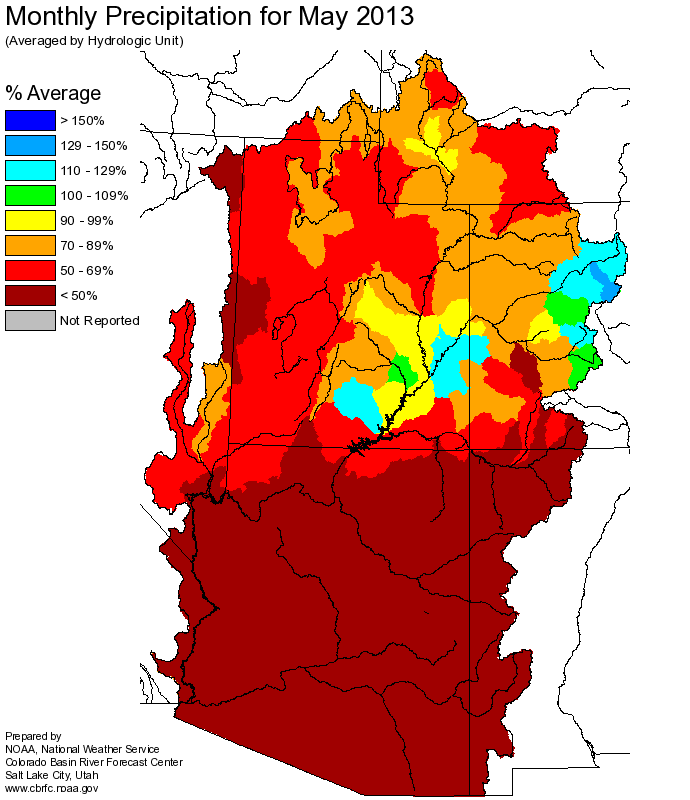
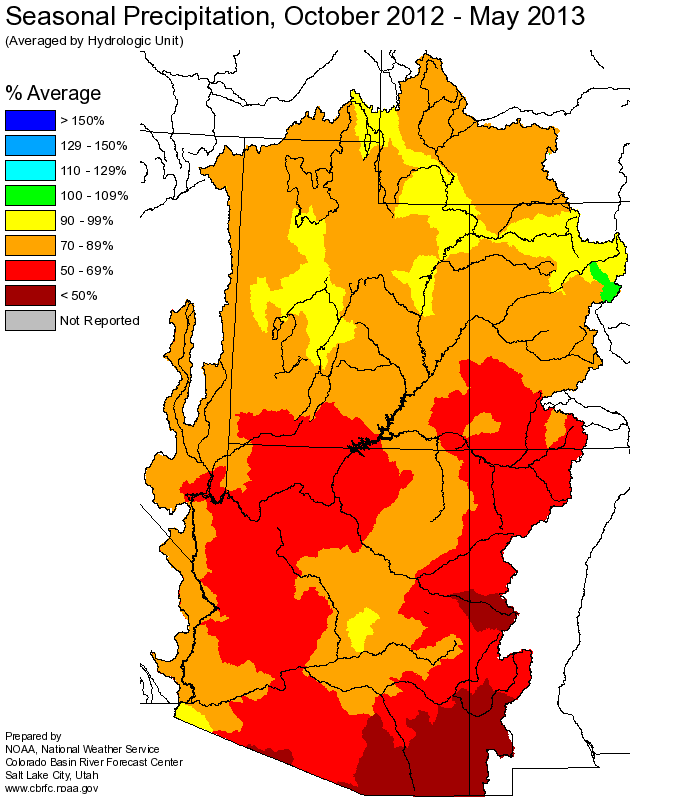
Precipitation Maps
Hydrologist:
Ashley Nielson