Lake Powell Water Supply Outlook, May 1, 2013
Note:
This publication is scheduled for revision. If you have feedback on content, format, or publication frequency, please
contact us
.
Prepared by
Alcorn
NOAA, National Weather Service
Colorado Basin River Forecast Center
Salt Lake City, Utah
www.cbrfc.noaa.gov
Contents
Upper Green Basin Conditions
Yampa/White Basin Conditions
Duchesne Basin Conditions
Lower Green Basin Conditions
Upper Colorado Mainstem Basin Conditions
Gunnison Basin Conditions
Dolores Basin Conditions
San Juan Basin Conditions
Upper Green Specific Site Forecasts
Yampa/White Specific Site Forecasts
Duchesne Specific Site Forecasts
Lower Green Specific Site Forecasts
Upper Colorado Mainstem Specific Site Forecasts
Gunnison Specific Site Forecasts
Dolores Specific Site Forecasts
San Juan Specific Site Forecasts
Reservoir Contents
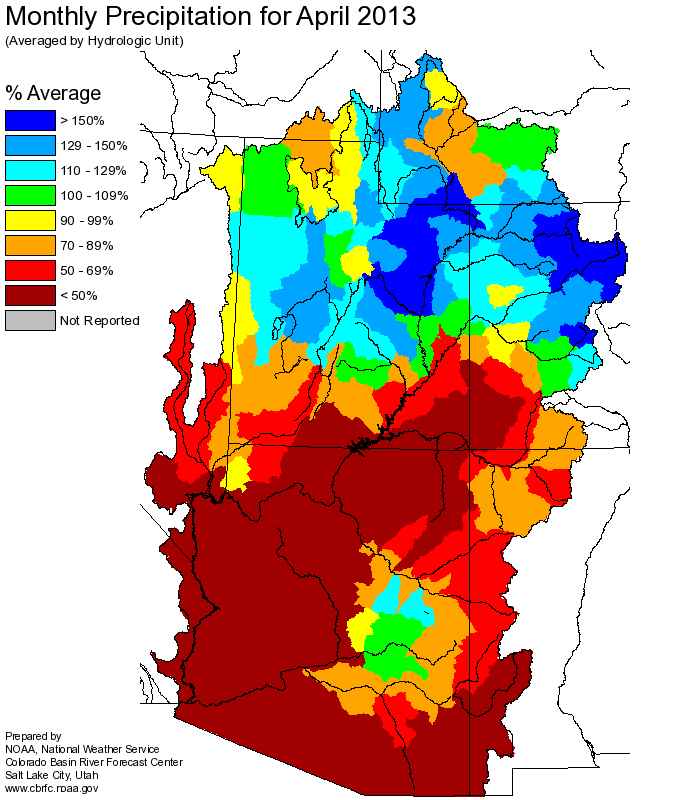
Precipitation Maps
Definitions
Additional Information
Questions or Comments
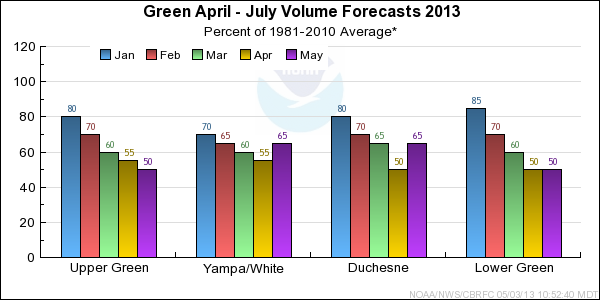
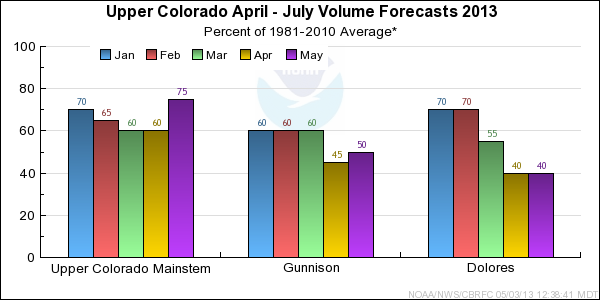
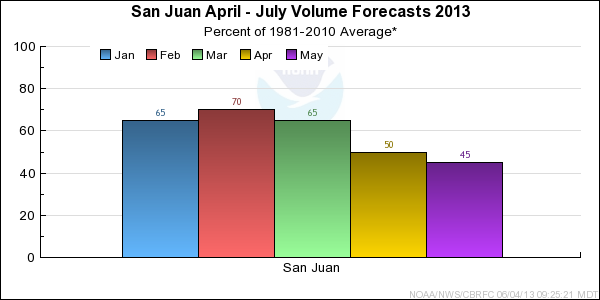
Lake Powell Sub-Basin Summaries
*Median of forecasts within each basin.
*Median of forecasts within each basin.
*Median of forecasts within each basin.
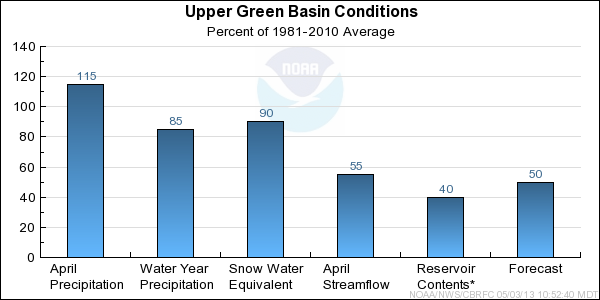
Upper Green Basin Conditions
* Percent usable capacity, not percent average contents.
Click for multi-month Graph.
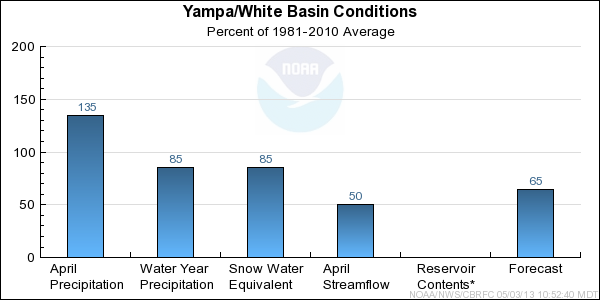
Yampa/White Basin Conditions
* Percent usable capacity, not percent average contents.
Click for multi-month Graph.
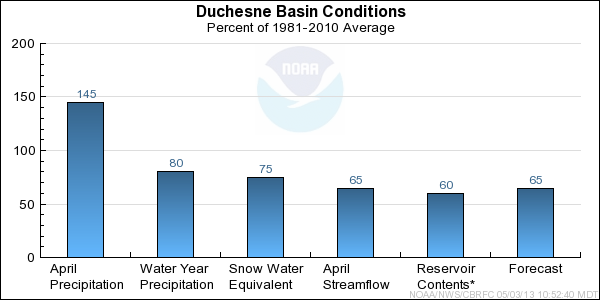
Duchesne Basin Conditions
* Percent usable capacity, not percent average contents.
Click for multi-month Graph.
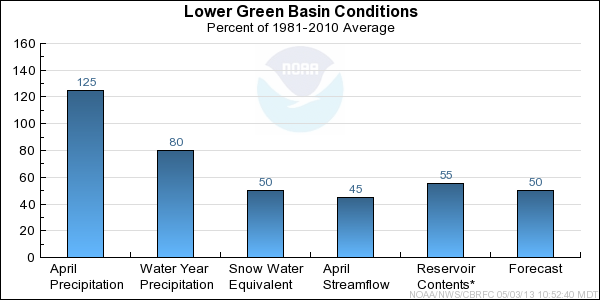
Lower Green Basin Conditions
* Percent usable capacity, not percent average contents.
Click for multi-month Graph.
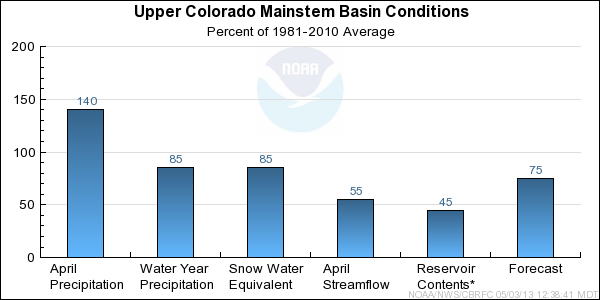
Upper Colorado Mainstem Basin Conditions
* Percent usable capacity, not percent average contents.
Click for multi-month Graph.
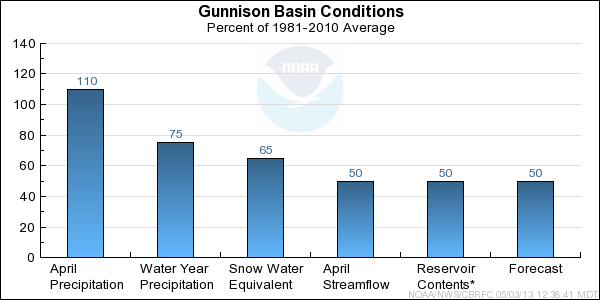
Gunnison Basin Conditions
* Percent usable capacity, not percent average contents.
Click for multi-month Graph.
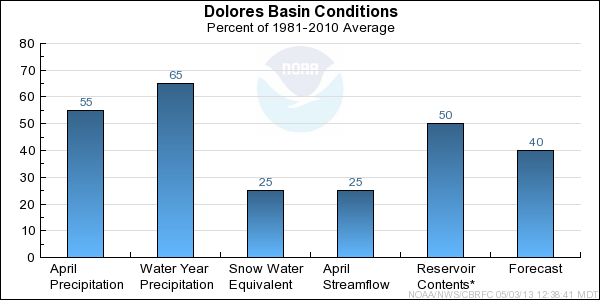
Dolores Basin Conditions
* Percent usable capacity, not percent average contents.
Click for multi-month Graph.
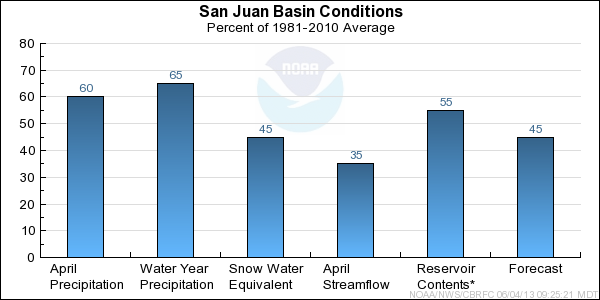
San Juan Basin Conditions
* Percent usable capacity, not percent average contents.
Click for multi-month Graph.
Differences between the full period forecasts and the residual forecasts may not exactly equal the actual observed volumes due to rounding conventions (see Definitions section).
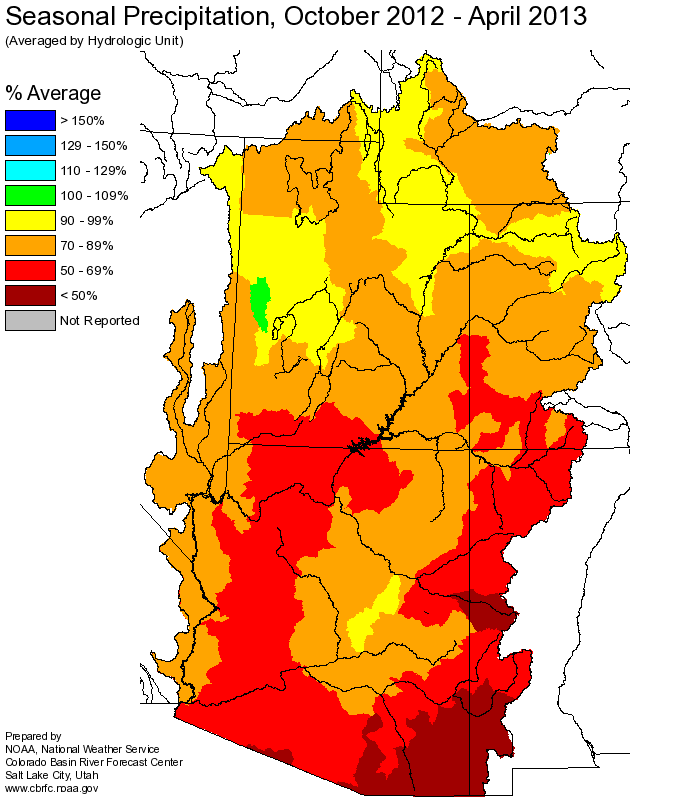
Precipitation Maps