NOAA, National Weather Service
Colorado Basin River Forecast Center
Salt Lake City, Utah
www.cbrfc.noaa.gov
| Prepared by Alcorn NOAA, National Weather Service Colorado Basin River Forecast Center Salt Lake City, Utah www.cbrfc.noaa.gov |
| Forecast Period | 90% Exceedance Volume | 50% Exceedance Volume | Percent Average | 10% Exceedance Volume | |
| Green | |||||
| Daniel, Nr, Warren Bridge, At | April-July | 146 | 182 | 74 | 215 |
| May-July | 125 | 161 | 72 | 195 | |
| Pine Ck | |||||
| Fremont Lk, Abv | April-July | 54 | 73 | 74 | 92 |
| May-July | 50 | 69 | 72 | 88 | |
| New Fork | |||||
| Big Piney, Nr | April-July | 137 | 205 | 58 | 300 |
| May-July | 117 | 185 | 56 | 280 | |
| Green | |||||
| Fontenelle Res, Fontenelle Nr | April-July | 360 | 495 | 68 | 630 |
| May-July | 275 | 410 | 64 | 545 | |
| Big Sandy | |||||
| Farson, Nr | April-July | 22 | 32 | 62 | 45 |
| May-July | 18.3 | 28 | 58 | 41 | |
| Green | |||||
| Green River, Wy, Nr | April-July | 340 | 475 | 65 | 620 |
| May-July | 260 | 395 | 62 | 540 | |
| Hams Fork | |||||
| Frontier, Nr, Pole Ck, Blo | April-July | 30 | 38 | 70 | 48 |
| May-July | 17 | 25 | 52 | 35 | |
| Viva Naughton Res | April-July | 36 | 44 | 59 | 57 |
| May-July | 21 | 29 | 47 | 42 | |
| Blacks Fork | |||||
| Robertson, Nr | April-July | 40 | 50 | 56 | 65 |
| May-July | 32 | 42 | 49 | 57 | |
| Ef Smiths Fork | |||||
| Stateline Res, Robertson,nr | April-July | 12.8 | 16 | 62 | 19.8 |
| May-July | 11 | 14.2 | 55 | 18 | |
| Green | |||||
| Flaming Gorge Res, Flaming Gorge Dam, At | April-July | 430 | 570 | 58 | 740 |
| May-July | 320 | 460 | 54 | 630 |
| Forecast Period | 90% Exceedance Volume | 50% Exceedance Volume | Percent Average | 10% Exceedance Volume | |
| Yampa | |||||
| Stagecoach Rsvr, Abv | April-July | 14.6 | 16.3 | 71 | 18.5 |
| May-July | 8 | 9.7 | 61 | 11.9 | |
| Steamboat Springs | April-July | 128 | 156 | 60 | 196 |
| May-July | 92 | 120 | 55 | 160 | |
| Elk | |||||
| Milner, Nr | April-July | 169 | 199 | 62 | 245 |
| May-July | 130 | 160 | 55 | 205 | |
| Elkhead Ck | |||||
| Long Gulch, Abv, Hayden, Nr | April-July | 26 | 31 | 42 | 40 |
| May-July | 9.8 | 14.8 | 30 | 23 | |
| Yampa | |||||
| Maybell, Nr | April-July | 405 | 480 | 51 | 605 |
| May-July | 280 | 355 | 46 | 480 | |
| Little Snake | |||||
| Slater, Nr | April-July | 71 | 86 | 55 | 109 |
| May-July | 52 | 67 | 49 | 90 | |
| Dixon, Nr | April-July | 107 | 134 | 39 | 182 |
| May-July | 75 | 102 | 35 | 150 | |
| Lily, Nr | April-July | 99 | 134 | 39 | 183 |
| May-July | 67 | 102 | 35 | 151 | |
| Yampa | |||||
| Deerlodge Park | April-July | 510 | 620 | 50 | 785 |
| May-July | 350 | 460 | 45 | 625 | |
| White | |||||
| Meeker, Nr | April-July | 155 | 180 | 64 | 230 |
| May-July | 110 | 135 | 55 | 184 | |
| Watson, Nr | April-July | 151 | 177 | 63 | 225 |
| May-July | 110 | 136 | 58 | 184 |
| Forecast Period | 90% Exceedance Volume | 50% Exceedance Volume | Percent Average | 10% Exceedance Volume | |
| Big Brush Ck | |||||
| Vernal, Nr, Red Fleet Res, Abv | April-July | 5.6 | 7.5 | 36 | 10.7 |
| May-July | 4.1 | 6 | 33 | 9.2 | |
| Ashley Ck | |||||
| Vernal, Nr | April-July | 13.7 | 17.3 | 35 | 24 |
| May-July | 11.3 | 14.9 | 32 | 22 | |
| West Fork Duchesne | |||||
| Vat Diversion, Blo | April-July | 5.4 | 7.2 | 39 | 9.9 |
| May-July | 4 | 5.8 | 34 | 8.5 | |
| Duchesne | |||||
| Tabiona, Nr | April-July | 47 | 58 | 54 | 69 |
| May-July | 37 | 48 | 49 | 59 | |
| Rock Ck | |||||
| Upper Stillwater Res | April-July | 35 | 45 | 61 | 53 |
| May-July | 28 | 38 | 54 | 46 | |
| South Fork Rock Ck | |||||
| Docs Div, Blo | April-July | 2.3 | 2.9 | 40 | 3.6 |
| May-July | 1.8 | 2.4 | 35 | 3.1 | |
| Rock Ck | |||||
| Mountain Home, Nr | April-July | 38 | 49 | 56 | 62 |
| May-July | 32 | 43 | 51 | 56 | |
| Currant Ck | |||||
| Currant Ck Res | April-July | 3.6 | 5 | 25 | 6.4 |
| May-July | 1.7 | 3.1 | 18.1 | 4.5 | |
| Strawberry | |||||
| Solider Springs,nr | April-July | 11.2 | 13.5 | 19 | 19.4 |
| May-July | 7.8 | 10.1 | 17.4 | 16 | |
| Starvation Res, Duchesne, Nr | April-July | 17.6 | 23 | 21 | 30 |
| May-July | 11.3 | 16.5 | 18.1 | 24 | |
| Duchesne | |||||
| Duchesne, Nr, Knight Div, Abv | April-July | 89 | 106 | 55 | 125 |
| May-July | 72 | 89 | 50 | 108 | |
| Lake Fork | |||||
| Moon Lake Res, Mtn Home, Nr | April-July | 24 | 30 | 45 | 40 |
| May-July | 21 | 27 | 43 | 37 | |
| Yellowstone | |||||
| Altonah, Nr | April-July | 26 | 32 | 52 | 42 |
| May-July | 23 | 29 | 51 | 39 | |
| Whiterocks | |||||
| Whiterocks, Nr | April-July | 19.2 | 25 | 46 | 34 |
| May-July | 17 | 23 | 45 | 32 | |
| Uinta | |||||
| Neola, Nr | April-July | 24 | 33 | 45 | 48 |
| May-July | 21 | 30 | 42 | 45 | |
| Duchesne | |||||
| Myton | April-July | 70 | 92 | 28 | 130 |
| May-July | 45 | 67 | 23 | 105 | |
| Randlett, Nr | April-July | 72 | 95 | 25 | 135 |
| May-July | 47 | 70 | 20 | 110 |
| Forecast Period | 90% Exceedance Volume | 50% Exceedance Volume | Percent Average | 10% Exceedance Volume | |
| White | |||||
| Blo Tabbyune Ck, Soldier Summit, Nr | April-July | 0.94 | 1.2 | 7.8 | 1.7 |
| May-July | 0.35 | 0.62 | 5.2 | 1.1 | |
| Fish Ck | |||||
| Scofield, Nr, Reservoir, Abv | April-July | 7.1 | 9.1 | 30 | 13 |
| May-July | 4.5 | 6.5 | 25 | 10.4 | |
| Price | |||||
| Scofield Res, Scofield, Nr | April-July | 8.1 | 11.1 | 27 | 15.9 |
| May-July | 4.5 | 7.5 | 21 | 12.3 | |
| Green | |||||
| Green River, Ut | April-July | 1150 | 1430 | 48 | 1830 |
| May-July | 825 | 1100 | 43 | 1500 | |
| Huntington Ck | |||||
| Electric Lake | April-July | 2.6 | 3.6 | 27 | 5.1 |
| May-July | 1.5 | 2.5 | 21 | 4 | |
| Power Plant, Blo | April-July | 15.7 | 17.2 | 43 | 21 |
| May-July | 13 | 14.5 | 39 | 18 | |
| Seeley Ck | |||||
| Joes Vly Res, Orangeville, Nr | April-July | 18 | 23 | 41 | 29 |
| May-July | 15.1 | 20 | 38 | 26 | |
| Ferron Ck | |||||
| Ferron, Nr | April-July | 15 | 18.8 | 49 | 25 |
| May-July | 12.9 | 16.7 | 48 | 23 | |
| Muddy Ck | |||||
| Emery, Nr | April-July | 7.3 | 9.1 | 46 | 11.8 |
| May-July | 6 | 7.8 | 43 | 10.5 |
| Forecast Period | 90% Exceedance Volume | 50% Exceedance Volume | Percent Average | 10% Exceedance Volume | |
| Colorado | |||||
| Lake Granby, Granby, Nr | April-July | 175 | 200 | 91 | 240 |
| May-July | 155 | 180 | 88 | 220 | |
| Willow Ck | |||||
| Willow Ck Res, Granby, Nr | April-July | 28 | 35 | 74 | 42 |
| May-July | 21 | 28 | 65 | 35 | |
| Fraser | |||||
| Winter Park | April-July | 15.1 | 17.1 | 88 | 21 |
| May-July | 14 | 16 | 86 | 20 | |
| Williams Fork | |||||
| Williams Fork Res, Parshall, Nr | April-July | 73 | 82 | 85 | 102 |
| May-July | 65 | 74 | 82 | 94 | |
| Muddy Ck | |||||
| Wolford Mountain Reservoir | April-July | 28 | 34 | 63 | 44 |
| May-July | 19 | 25 | 54 | 35 | |
| Blue | |||||
| Dillon Res | April-July | 148 | 170 | 104 | 200 |
| May-July | 135 | 157 | 103 | 187 | |
| Green Mtn Res | April-July | 235 | 265 | 96 | 320 |
| May-July | 210 | 240 | 94 | 295 | |
| Colorado | |||||
| Kremmling, Nr | April-July | 640 | 730 | 85 | 890 |
| May-July | 550 | 640 | 82 | 800 | |
| Eagle | |||||
| Gypsum, Blo | April-July | 200 | 245 | 73 | 320 |
| May-July | 175 | 220 | 70 | 295 | |
| Colorado | |||||
| Dotsero, Nr | April-July | 930 | 1080 | 77 | 1340 |
| May-July | 790 | 940 | 73 | 1200 | |
| Frying Pan | |||||
| Ruedi Res, Basalt, Nr | April-July | 86 | 100 | 72 | 141 |
| May-July | 77 | 91 | 70 | 132 | |
| Roaring Fork | |||||
| Glenwood Springs | April-July | 420 | 470 | 68 | 605 |
| May-July | 370 | 420 | 66 | 555 | |
| Colorado | |||||
| Glenwood Springs, Blo | April-July | 1360 | 1570 | 74 | 1970 |
| May-July | 1160 | 1370 | 71 | 1770 | |
| Cameo, Nr | April-July | 1380 | 1600 | 68 | 2050 |
| May-July | 1180 | 1400 | 65 | 1850 | |
| Plateau Ck | |||||
| Cameo, Nr | April-July | 31 | 40 | 32 | 51 |
| May-July | 22 | 31 | 30 | 42 | |
| Colorado | |||||
| Cisco, Nr | April-July | 2270 | 2580 | 58 | 3300 |
| May-July | 1860 | 2170 | 56 | 2890 | |
| Lake Powell, Glen Cyn Dam, At | April-July | 2250 | 3000 | 42 | 4220 |
| May-July | 1610 | 2360 | 39 | 3580 |
| Forecast Period | 90% Exceedance Volume | 50% Exceedance Volume | Percent Average | 10% Exceedance Volume | |
| Taylor | |||||
| Taylor Park Res | April-July | 49 | 62 | 63 | 79 |
| May-July | 40 | 53 | 59 | 70 | |
| Almont | April-July | 76 | 96 | 62 | 121 |
| May-July | 63 | 83 | 59 | 108 | |
| East | |||||
| Almont | April-July | 79 | 104 | 57 | 129 |
| May-July | 60 | 85 | 51 | 110 | |
| Gunnison | |||||
| Gunnison, Nr | April-July | 172 | 197 | 53 | 245 |
| May-July | 135 | 160 | 48 | 210 | |
| Tomichi Ck | |||||
| Gunnison | April-July | 38 | 50 | 68 | 69 |
| May-July | 29 | 41 | 66 | 60 | |
| Lake Fork | |||||
| Gateview | April-July | 74 | 94 | 76 | 114 |
| May-July | 65 | 85 | 73 | 105 | |
| Gunnison | |||||
| Blue Mesa Res | April-July | 370 | 440 | 65 | 540 |
| May-July | 300 | 365 | 61 | 470 | |
| Morrow Point Res | April-July | 405 | 470 | 64 | 575 |
| May-July | 330 | 395 | 61 | 500 | |
| Crystal Res | April-July | 450 | 510 | 61 | 620 |
| May-July | 370 | 430 | 59 | 540 | |
| Muddy Ck | |||||
| Paonia Res, Bardine, Nr | March-June | 29 | 34 | 35 | 49 |
| April-July | 25 | 30 | 31 | 45 | |
| May-June | 15 | 20 | 29 | 35 | |
| May-July | 16 | 21 | 28 | 36 | |
| Nf Gunnison | |||||
| Somerset, Nr | April-July | 102 | 127 | 43 | 172 |
| May-July | 75 | 100 | 42 | 145 | |
| Surface Ck | |||||
| Cedaredge | April-July | 3.5 | 5 | 30 | 8 |
| May-July | 1.5 | 3 | 21 | 6 | |
| Uncompahgre | |||||
| Ridgway Res | April-July | 50 | 60 | 59 | 78 |
| May-July | 44 | 54 | 59 | 72 | |
| Colona | April-July | 47 | 65 | 47 | 87 |
| May-July | 40 | 58 | 48 | 80 | |
| Delta | April-July | 25 | 36 | 32 | 55 |
| May-July | 20 | 31 | 33 | 50 | |
| Gunnison | |||||
| Grand Junction, Nr | April-July | 590 | 765 | 52 | 955 |
| May-July | 450 | 625 | 50 | 815 |
| Forecast Period | 90% Exceedance Volume | 50% Exceedance Volume | Percent Average | 10% Exceedance Volume | |
| Dolores | |||||
| Dolores | April-July | 88 | 111 | 45 | 137 |
| May-July | 66 | 89 | 45 | 115 | |
| Mcphee Res | April-July | 86 | 108 | 37 | 131 |
| May-July | 65 | 87 | 40 | 110 | |
| San Miguel | |||||
| Placerville, Nr | April-July | 60 | 78 | 61 | 100 |
| May-July | 50 | 68 | 60 | 90 | |
| Dolores | |||||
| Cisco, Nr | April-July | 150 | 152 | 27 | 235 |
| May-July | 115 | 117 | 28 | 200 |
| Forecast Period | 90% Exceedance Volume | 50% Exceedance Volume | Percent Average | 10% Exceedance Volume | |
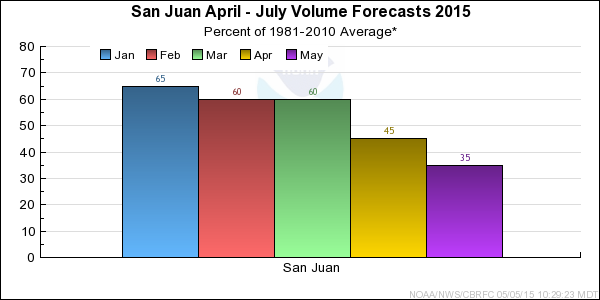
| San Juan | |||||
| Pagosa Springs | April-July | 53 | 68 | 32 | 85 |
| May-July | 30 | 45 | 25 | 62 | |
| Carracas, Nr | April-July | 96 | 122 | 32 | 151 |
| May-July | 60 | 86 | 29 | 115 | |
| Navajo Res, Archuleta, Nr | April-July | 170 | 230 | 31 | 300 |
| May-July | 90 | 150 | 27 | 220 | |
| Farmington | April-July | 255 | 320 | 29 | 455 |
| May-July | 160 | 225 | 26 | 360 | |
| Bluff, Nr | April-July | 250 | 300 | 27 | 430 |
| May-July | 150 | 200 | 23 | 330 | |
| Rio Blanco | |||||
| Pagosa Springs, Nr, Blanco Dam, Blo | April-July | 14.2 | 20 | 37 | 26 |
| May-July | 9 | 14.8 | 33 | 21 | |
| Navajo | |||||
| Chromo, Nr, Oso Div Dam, Blo | April-July | 15.6 | 23 | 35 | 31 |
| May-July | 10 | 17 | 31 | 25 | |
| Piedra | |||||
| Arboles, Nr | April-July | 72 | 84 | 40 | 105 |
| May-July | 43 | 55 | 36 | 76 | |
| Los Pinos | |||||
| Vallecito Res, Bayfield, Nr | April-July | 74 | 94 | 48 | 116 |
| May-July | 55 | 75 | 44 | 97 | |
| Animas | |||||
| Durango | April-July | 154 | 205 | 49 | 270 |
| May-July | 120 | 171 | 47 | 235 | |
| Florida | |||||
| Lemon Res, Durango, Nr | April-July | 15.4 | 22 | 40 | 30 |
| May-July | 10.5 | 17.1 | 35 | 25 | |
| La Plata | |||||
| Hesperus | April-July | 4.5 | 7.9 | 34 | 10.9 |
| May-July | 2.6 | 6 | 33 | 9 | |
| Mancos | |||||
| Mancos, Nr | April-July | 5 | 9.5 | 31 | 12 |
| May-July | 4 | 8.5 | 35 | 11 |
| EOM Contents | Percent EOM Average | Percent Usable Capacity | Last Year EOM | Last Year %Average | EOM Average | Usable Capacity | ||
| Vallecito Res, Bayfield, Nr
| | 108.3 | 146 | 86 | 105.8 | 143 | 74.0 | 125.4 |
| Navajo Res, Archuleta, Nr
| | 1170.5 | 86 | 69 | 1052.7 | 77 | 1361.0 | 1696.0 |
| Lemon Res, Durango, Nr
| | 28.1 | 117 | 70 | 24.7 | 103 | 24.1 | 39.8 |
|
| ||||||||
| TOTAL | 1306.8 | 90 | 70 | 1183.2 | 81 | 1459.0 | 1861.2 |
| Range | Round to | |
| 0-1.99 | 0.01 | |
| 2.0-19.9 | 0.1 | |
| 20-199 | 1.0 | |
| 200-999 | 5.0 | |
| 1000+ | 3 significant digits |