NOAA, National Weather Service
Colorado Basin River Forecast Center
Salt Lake City, Utah
www.cbrfc.noaa.gov
| Prepared by Greg Smith NOAA, National Weather Service Colorado Basin River Forecast Center Salt Lake City, Utah www.cbrfc.noaa.gov |

| Forecast Period | 90% Exceedance Volume | 50% Exceedance Volume | Percent Average | 10% Exceedance Volume | |||
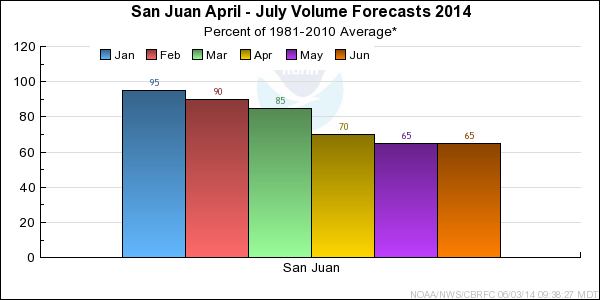
| San Juan | |||||||
| Pagosa Springs | April-July | 134 | 139 | 65 | 145 | ||
| June-July | 35 | 40 | 42 | 46 | |||
| Carracas, Nr | April-July | 205 | 220 | 58 | 230 | ||
| June-July | 65 | 80 | 51 | 88 | |||
| Navajo Res, Archuleta, Nr | April-July | 430 | 455 | 62 | 495 | ||
| June-July | 131 | 156 | 54 | 196 | |||
| Farmington | April-July | 720 | 760 | 69 | 795 | ||
| June-July | 260 | 300 | 64 | 335 | |||
| Bluff, Nr | April-July | 650 | 695 | 63 | 735 | ||
| June-July | 240 | 285 | 63 | 325 | |||
| Rio Blanco | |||||||
| Pagosa Springs, Nr, Blanco Dam, Blo | April-July | 30 | 33 | 61 | 36 | ||
| June-July | 7 | 10 | 43 | 13 | |||
| Navajo | |||||||
| Chromo, Nr, Oso Div Dam, Blo | April-July | 32 | 36 | 55 | 39 | ||
| June-July | 12 | 16 | 53 | 19 | |||
| Piedra | |||||||
| Arboles, Nr | April-July | 134 | 143 | 68 | 152 | ||
| June-July | 36 | 45 | 61 | 54 | |||
| Los Pinos | |||||||
| Vallecito Res, Bayfield, Nr | April-July | 160 | 169 | 87 | 188 | ||
| June-July | 72 | 81 | 82 | 100 | |||
| Animas | |||||||
| Durango | April-July | 345 | 365 | 88 | 405 | ||
| June-July | 173 | 193 | 88 | 235 | |||
| Florida | |||||||
| Lemon Res, Durango, Nr | April-July | 36 | 42 | 76 | 47 | ||
| June-July | 12 | 18 | 67 | 23 | |||
| La Plata | |||||||
| Hesperus | April-July | 10.9 | 11.4 | 50 | 12.2 | ||
| June-July | 3.5 | 4 | 47 | 4.8 | |||
| Mancos | |||||||
| Mancos, Nr | April-July | 13.4 | 14.1 | 45 | 15.6 | ||
| June-July | 4.8 | 5.5 | 53 | 7 |
| EOM Contents | Percent EOM Average | Percent Usable Capacity | Last Year EOM | Last Year %Average | EOM Average | Usable Capacity | |
|
| |||||||
| Vallecito Res, Bayfield, Nr | 105.8 | 143 | 84 | 62.7 | 85 | 74.0 | 125.4 |
|
| |||||||
| Navajo Res, Archuleta, Nr | 1052.7 | 77 | 62 | 928.4 | 68 | 1361.0 | 1696.0 |
|
| |||||||
| Lemon Res, Durango, Nr | 24.7 | 103 | 62 | 11.2 | 46 | 24.1 | 39.8 |
|
| |||||||
| TOTAL | 1183.2 | 81 | 64 | 1002.3 | 69 | 1459.0 | 1861.2 |
| Range | Round to | |
| 0-1.99 | 0.01 | |
| 2.0-19.9 | 0.1 | |
| 20-199 | 1.0 | |
| 200-999 | 5.0 | |
| 1000+ | 3 significant digits |