NOAA, National Weather Service
Colorado Basin River Forecast Center
Salt Lake City, Utah
www.cbrfc.noaa.gov
| Prepared by Brenda Alcorn, Greg Smith NOAA, National Weather Service Colorado Basin River Forecast Center Salt Lake City, Utah www.cbrfc.noaa.gov |
| Forecast Period | 90% Exceedance Volume | 50% Exceedance Volume | Percent Average | 10% Exceedance Volume | |
| Colorado | |||||
| Lake Granby, Granby, Nr | April-July | 185 | 260 | 118 | 365 |
| Willow Ck | |||||
| Willow Ck Res, Granby, Nr | April-July | 31 | 50 | 106 | 90 |
| Fraser | |||||
| Winter Park | April-July | 18 | 25 | 129 | 31 |
| Williams Fork | |||||
| Williams Fork Res, Parshall, Nr | April-July | 80 | 115 | 120 | 160 |
| Muddy Ck | |||||
| Wolford Mountain Reservoir | April-July | 43 | 70 | 130 | 92 |
| Blue | |||||
| Dillon Res | April-July | 150 | 210 | 129 | 275 |
| Green Mtn Res | April-July | 235 | 340 | 124 | 460 |
| Colorado | |||||
| Kremmling, Nr | April-July | 740 | 1030 | 120 | 1470 |
| Eagle | |||||
| Gypsum, Blo | April-July | 250 | 375 | 112 | 550 |
| Colorado | |||||
| Dotsero, Nr | April-July | 1180 | 1650 | 118 | 2260 |
| Frying Pan | |||||
| Ruedi Res, Basalt, Nr | April-July | 113 | 160 | 115 | 215 |
| Roaring Fork | |||||
| Glenwood Springs | April-July | 530 | 735 | 107 | 1000 |
| Colorado | |||||
| Glenwood Springs, Blo | April-July | 1750 | 2400 | 114 | 3300 |
| Cameo, Nr | April-July | 1900 | 2690 | 114 | 3750 |
| Plateau Ck | |||||
| Cameo, Nr | April-July | 65 | 115 | 93 | 177 |
| Colorado | |||||
| Cisco, Nr | April-July | 3450 | 4800 | 108 | 6950 |
| Lake Powell, Glen Cyn Dam, At | April-July | 4750 | 7250 | 101 | 10300 |
| Forecast Period | 90% Exceedance Volume | 50% Exceedance Volume | Percent Average | 10% Exceedance Volume | |
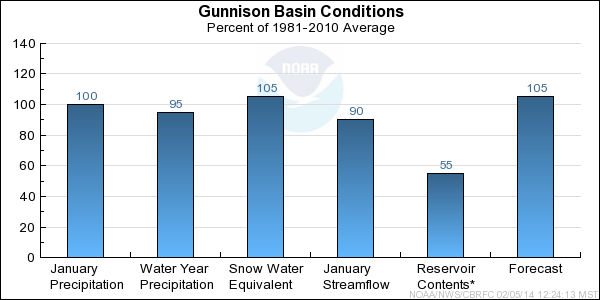
| Taylor | |||||
| Taylor Park Res | April-July | 77 | 112 | 113 | 146 |
| Almont | April-July | 115 | 177 | 114 | 230 |
| East | |||||
| Almont | April-July | 135 | 195 | 107 | 260 |
| Gunnison | |||||
| Gunnison, Nr | April-July | 275 | 415 | 112 | 570 |
| Tomichi Ck | |||||
| Gunnison | April-July | 46 | 76 | 103 | 110 |
| Lake Fork | |||||
| Gateview | April-July | 96 | 136 | 111 | 185 |
| Gunnison | |||||
| Blue Mesa Res | April-July | 500 | 755 | 112 | 1070 |
| Morrow Point Res | April-July | 570 | 825 | 111 | 1140 |
| Crystal Res | April-July | 650 | 925 | 111 | 1240 |
| Muddy Ck | |||||
| Paonia Res, Bardine, Nr | March-June | 70 | 100 | 104 | 136 |
| April-July | 70 | 102 | 105 | 140 | |
| Nf Gunnison | |||||
| Somerset, Nr | April-July | 210 | 300 | 102 | 420 |
| Surface Ck | |||||
| Cedaredge | April-July | 10 | 15 | 89 | 22 |
| Uncompahgre | |||||
| Ridgway Res | April-July | 68 | 97 | 96 | 138 |
| Colona | April-July | 89 | 133 | 97 | 193 |
| Delta | April-July | 68 | 110 | 97 | 169 |
| Gunnison | |||||
| Grand Junction, Nr | April-July | 1000 | 1550 | 105 | 2270 |
| Forecast Period | 90% Exceedance Volume | 50% Exceedance Volume | Percent Average | 10% Exceedance Volume | |
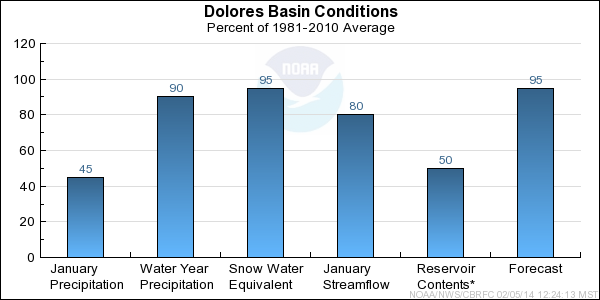
| Dolores | |||||
| Dolores | April-July | 160 | 235 | 96 | 330 |
| Mcphee Res | April-July | 177 | 280 | 95 | 390 |
| San Miguel | |||||
| Placerville, Nr | April-July | 85 | 130 | 102 | 177 |
| Dolores | |||||
| Cisco, Nr | April-July | 320 | 540 | 96 | 740 |
| Range | Round to | |
| 0-1.99 | 0.01 | |
| 2.0-19.9 | 0.1 | |
| 20-199 | 1.0 | |
| 200-999 | 5.0 | |
| 1000+ | 3 significant digits |