Lake Powell Water Supply Outlook, June 1, 2008
Note: This publication is scheduled for revision. If you have feedback on content, format, or publication frequency, please contact us.
Contents
Lake Powell Sub-Basin Summaries
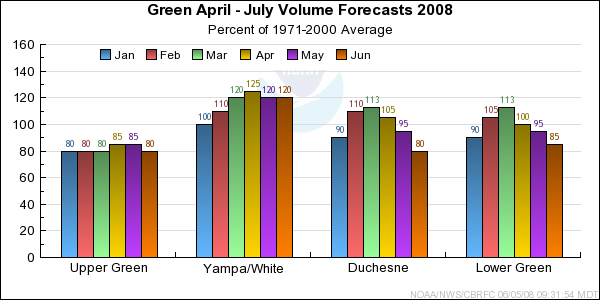
Variable runoff conditions continue throughout the Green River Basin. Portions of the Yampa and
White have reported average flows in May, while the Upper Green observed flows have been much below
average. The outlooks for the rest of the runoff period ranges from above average in the Yampa
to below average for portions of the Upper Green. For the majority of points, ESP forecast
values were weighted higher than statistical methods.
*Median of forecasts within each basin.
The Upper Colorado mainstem and the Gunnison basin both received above average precipitation for the month, but the Dolores basin only received 80% of average. Temperatures averaged over the entire month were near to slightly below average in western Colorado during May, but daily temperatures within the month fluctuated between periods of much above and much below average temperatures. As a result, May runoff volumes were much above average in the Upper Colorado and Gunnison, but there is plenty of snow left to melt as June 1st snow water equivalent is much above average. May runoff volumes in the Dolores basin were near normal and June 1st snow water equivalent is below average. The median of the forecasts for the April through July runoff volumes increased in the Upper Colorado and Gunnison, but decreased in the Dolores.

*Median of forecasts within each basin.
-Observed Streamflow...Streamflow for the month of May was average to above
average for the San Juan Basin.
-Snowpack/Precipitation...Snowpack above Navajo Reservoir dropped to 105 percent
of average. The Animas was below average for snowpack while the entire San Juan
Basin dropped to 90 percent. Precipitation over the San Juan Basin for May was
average with 100 percent. Seasonal average precipitation for the San Juan
Basin dropped slightly to 105 percent.
-Short Term Precipitation Forecast...The forecast models through the next five days
forecast 2 to 6 tenths of an inch of water over the San Juan Basin into Thursday
evening. Relatively dry conditions will return this weekend into early next week.
Temperatures over the next five days will be near to slightly below normal into Friday
but rebound to above normal by early next week. The CPC forecast for days 6 through
10 have an increased chance for above normal temperatures and below normal
precipitation.
-General Discussion...The current snowpack along with both statistical forecasts
and ESP numbers suggest keeping the same forecast across all of the headwaters of the
San Juan Basin. Near average precipitation across the San Juan Basin during the past
month also reflect current thinking of generally keeping the same volume forecasts
for the San Juan. CPC guidance for the remainder of June continues to show an
increased chance of above normal temperatures and near to slightly below normal
precipitation.

*Median of forecasts within each basin.
Upper Green Basin Conditions
Precipitation in the Upper Green was above average in May. Basin wide, the snowpack is
115 percent of the June 1st average. Many Snotel sites along the Wind River Range
are reporting snow free conditions, though upper elevation modeled snow states remain near average.

* Percent usable capacity, not percent average contents.
Click for multi-month Graph.
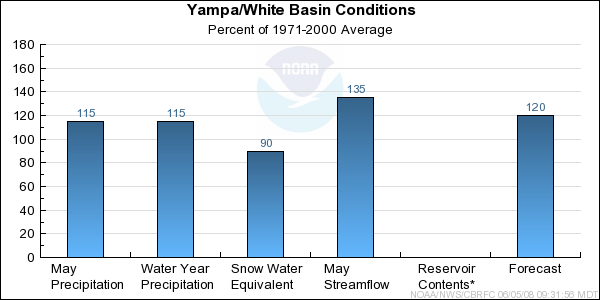
Yampa/White Basin Conditions
Substantial seasonal snowpack in the headwaters of the Yampa and Little Snake have translated into
above average May observed flows for a number of forecasts points in the basin. Above average
flows are forecasted for the rest of the runoff period.
* Percent usable capacity, not percent average contents.
Click for multi-month Graph.
Duchesne Basin Conditions
Forecasts for the remainder of the runoff period are in the near average to below average for points
in the Duchesne Basin.

* Percent usable capacity, not percent average contents.
Click for multi-month Graph.
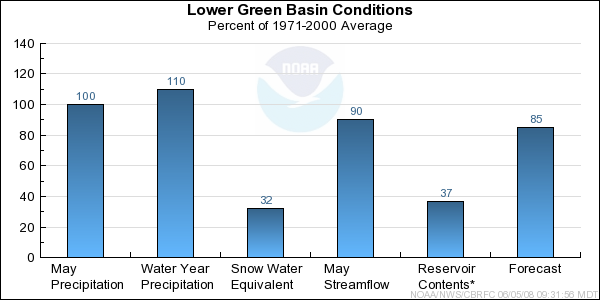
Lower Green Basin Conditions
Forecasts for the remainder of the runoff period range from near average in the Price drainage to below average
in the in the headwaters of the San Rafael.
* Percent usable capacity, not percent average contents.
Click for multi-month Graph.
Upper Colorado Mainstem Basin Conditions
After two months of slightly below average precipitation, the Upper Colorado mainstem basin returned to wetter conditions during May with 110% of average precipitation for the month. This, combined with already high snowpack and near to slightly below average monthly temperatures, left the June 1st snow water equivalent values at much above average. The April through July streamflow forecasts were raised at most points in the basin, although some did go down because of low observed flows to date. These forecasts now range between 98% and 145% of average, with the exception of Mill Creek which is forecast at 66% of average.

* Percent usable capacity, not percent average contents.
Click for multi-month Graph.
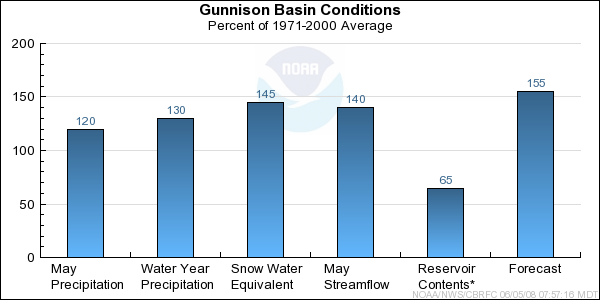
Gunnison Basin Conditions
Precipitation was above average in the month of May for the Gunnison Basin. Maximum temperatures were again below average resulting in a slower melting of the snow pack. However, runoff volumes in the Gunnison Basin were above average for May because of the above average snow pack.
April through July volume forecasts in the Taylor Basin and Blue Mesa Reservoir have been been increased due to the above average precipitation in May. April through July volume forecasts in the rest of the basin remained steady.
* Percent usable capacity, not percent average contents.
Click for multi-month Graph.
Dolores Basin Conditions
The Dolores Basin did not fair as well as the rest of the Upper Colorado only receiving 80% of the average May precipitation. However, maximum temperatures were below average in May like the rest of the Upper Colorado. Runoff volume in the basin was around average for May.
There is little snow remaining in the Dolores Basin. This, along with below average precipitation for May, has resulted in a 5% to 10% decrease in the April through July volume forecasts in the Dolores Basin.
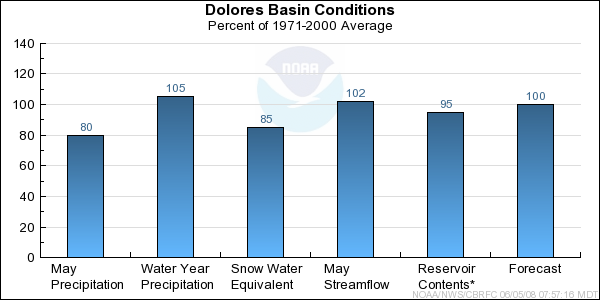
* Percent usable capacity, not percent average contents.
Click for multi-month Graph.
San Juan Basin Conditions
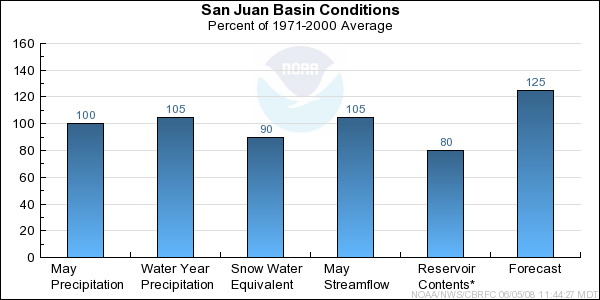
* Percent usable capacity, not percent average contents.
Click for multi-month Graph.
Differences between the full period forecasts and the residual forecasts may not exactly equal the actual observed volumes due to rounding conventions (see Definitions section).
Precipitation Maps


