NOAA, National Weather Service
Colorado Basin River Forecast Center
Salt Lake City, Utah
www.cbrfc.noaa.gov
| Prepared by Ashley Nielson NOAA, National Weather Service Colorado Basin River Forecast Center Salt Lake City, Utah www.cbrfc.noaa.gov |
| Forecast Period | 90% Exceedance Volume | 70% Exceedance Volume | 50% Exceedance Volume | Percent Average | 30% Exceedance Volume | 10% Exceedance Volume | |
| Green | |||||||
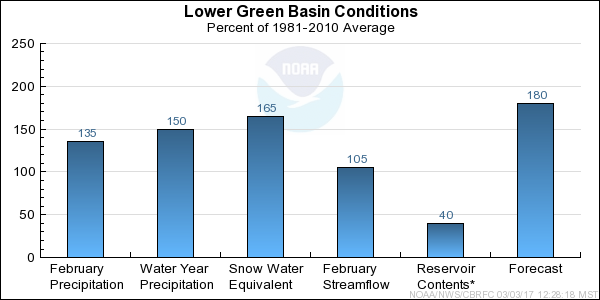
| Daniel, Nr, Warren Bridge, At | April-July | 385 | 425 | 440 | 180 | 465 | 500 |
| Pine Ck | |||||||
| Fremont Lk, Abv | April-July | 124 | 130 | 143 | 146 | 148 | 160 |
| New Fork | |||||||
| Big Piney, Nr | April-July | 550 | 610 | 645 | 182 | 700 | 775 |
| Green | |||||||
| Fontenelle Res, Fontenelle Nr | April-July | 1390 | 1500 | 1680 | 232 | 1830 | 2020 |
| Big Sandy | |||||||
| Farson, Nr | April-July | 68 | 82 | 86 | 165 | 92 | 109 |
| Green | |||||||
| Green River, Wy, Nr | April-July | 1410 | 1560 | 1730 | 237 | 1900 | 2100 |
| Hams Fork | |||||||
| Frontier, Nr, Pole Ck, Blo | April-July | 88 | 96 | 108 | 200 | 119 | 134 |
| Viva Naughton Res | April-July | 127 | 140 | 156 | 211 | 175 | 200 |
| Blacks Fork | |||||||
| Robertson, Nr | April-July | 99 | 106 | 119 | 134 | 137 | 158 |
| Ef Smiths Fork | |||||||
| Stateline Res, Robertson,nr | April-July | 29 | 33 | 36 | 138 | 40 | 45 |
| Green | |||||||
| Flaming Gorge Res, Flaming Gorge Dam, At | April-July | 1840 | 1970 | 2260 | 231 | 2480 | 2850 |
| Forecast Period | 90% Exceedance Volume | 70% Exceedance Volume | 50% Exceedance Volume | Percent Average | 30% Exceedance Volume | 10% Exceedance Volume | |
| Yampa | |||||||
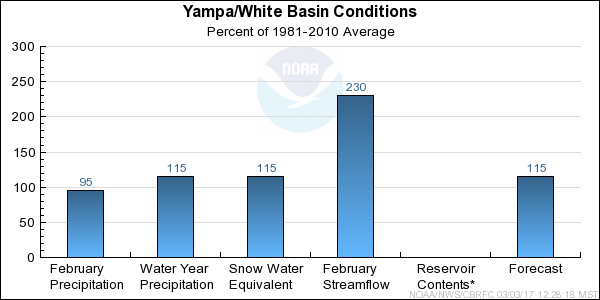
| Stagecoach Rsvr, Abv | April-July | 17.5 | 20 | 22 | 96 | 24 | 36 |
| Steamboat Springs | April-July | 187 | 235 | 255 | 98 | 300 | 355 |
| Elk | |||||||
| Milner, Nr | April-July | 275 | 345 | 375 | 117 | 415 | 480 |
| Elkhead Ck | |||||||
| Long Gulch, Abv, Hayden, Nr | April-July | 60 | 77 | 87 | 119 | 96 | 120 |
| Yampa | |||||||
| Maybell, Nr | April-July | 715 | 900 | 1030 | 110 | 1170 | 1420 |
| Little Snake | |||||||
| Slater, Nr | April-July | 134 | 167 | 185 | 119 | 205 | 250 |
| Dixon, Nr | April-July | 280 | 355 | 400 | 116 | 445 | 570 |
| Lily, Nr | April-July | 280 | 375 | 430 | 125 | 485 | 595 |
| Yampa | |||||||
| Deerlodge Park | April-July | 1030 | 1300 | 1500 | 121 | 1620 | 1980 |
| White | |||||||
| Meeker, Nr | April-July | 205 | 245 | 270 | 96 | 295 | 380 |
| Watson, Nr | April-July | 220 | 270 | 290 | 104 | 325 | 425 |
| Forecast Period | 90% Exceedance Volume | 70% Exceedance Volume | 50% Exceedance Volume | Percent Average | 30% Exceedance Volume | 10% Exceedance Volume | |
| Big Brush Ck | |||||||
| Vernal, Nr, Red Fleet Res, Abv | April-July | 18.9 | 24 | 27 | 129 | 29 | 37 |
| Ashley Ck | |||||||
| Vernal, Nr | April-July | 48 | 57 | 68 | 136 | 73 | 91 |
| West Fork Duchesne | |||||||
| Vat Diversion, Blo | April-July | 30 | 33 | 36 | 194 | 38 | 42 |
| Duchesne | |||||||
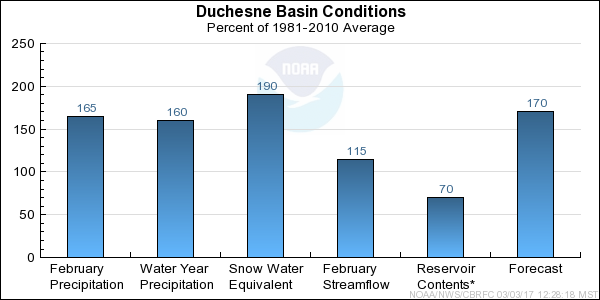
| Tabiona, Nr | April-July | 157 | 169 | 183 | 169 | 196 | 215 |
| Rock Ck | |||||||
| Upper Stillwater Res | April-July | 104 | 119 | 126 | 170 | 136 | 148 |
| South Fork Rock Ck | |||||||
| Docs Div, Blo | April-July | 11.1 | 12.6 | 13.8 | 189 | 14.7 | 16 |
| Rock Ck | |||||||
| Mountain Home, Nr | April-July | 127 | 144 | 155 | 176 | 166 | 180 |
| Currant Ck | |||||||
| Currant Ck Res | April-July | 34 | 38 | 42 | 210 | 46 | 50 |
| Strawberry | |||||||
| Solider Springs,nr | April-July | 98 | 116 | 130 | 183 | 148 | 172 |
| Starvation Res, Duchesne, Nr | April-July | 192 | 225 | 260 | 232 | 300 | 335 |
| Duchesne | |||||||
| Duchesne, Nr, Knight Div, Abv | April-July | 280 | 310 | 335 | 173 | 355 | 390 |
| Lake Fork | |||||||
| Moon Lake Res, Mtn Home, Nr | April-July | 84 | 99 | 108 | 164 | 116 | 129 |
| Yellowstone | |||||||
| Altonah, Nr | April-July | 78 | 96 | 103 | 169 | 114 | 126 |
| Whiterocks | |||||||
| Whiterocks, Nr | April-July | 60 | 73 | 85 | 157 | 89 | 106 |
| Uinta | |||||||
| Neola, Nr | April-July | 93 | 115 | 125 | 169 | 136 | 154 |
| Duchesne | |||||||
| Myton | April-July | 520 | 615 | 670 | 203 | 760 | 830 |
| Randlett, Nr | April-July | 595 | 700 | 800 | 208 | 910 | 1020 |
| Forecast Period | 90% Exceedance Volume | 70% Exceedance Volume | 50% Exceedance Volume | Percent Average | 30% Exceedance Volume | 10% Exceedance Volume | |
| White | |||||||
| Blo Tabbyune Ck, Soldier Summit, Nr | April-July | 26 | 33 | 37 | 239 | 42 | 48 |
| Fish Ck | |||||||
| Scofield, Nr, Reservoir, Abv | April-July | 46 | 49 | 55 | 183 | 59 | 70 |
| Price | |||||||
| Scofield Res, Scofield, Nr | April-July | 62 | 66 | 78 | 190 | 87 | 103 |
| Green | |||||||
| Green River, Ut | April-July | 4080 | 4540 | 5000 | 169 | 5850 | 6550 |
| Huntington Ck | |||||||
| Electric Lake | April-July | 23 | 25 | 28 | 211 | 31 | 36 |
| Power Plant, Blo | April-July | 67 | 74 | 85 | 213 | 91 | 105 |
| Seeley Ck | |||||||
| Joes Vly Res, Orangeville, Nr | April-July | 63 | 74 | 80 | 143 | 91 | 109 |
| Ferron Ck | |||||||
| Ferron, Nr | April-July | 41 | 49 | 56 | 147 | 59 | 75 |
| Muddy Ck | |||||||
| Emery, Nr | April-July | 19.7 | 24 | 28 | 141 | 32 | 39 |
| EOM Contents | Percent EOM Average | Percent Usable Capacity | Last Year EOM | Last Year %Average | EOM Average | Usable Capacity | |
|
| |||||||
| Fontenelle Res, Fontenelle Nr | 177.6 | 139 | 52 | 148.6 | 116 | 127.6 | 344.8 |
|
| |||||||
| Big Sandy Res, Farson, Nr | 24.7 | 164 | 65 | 20.4 | 135 | 15.1 | 38.3 |
| Blacks Fork | |||||||
| Meeks Cabin | 12.5 | 101 | 42 | 8.1 | 66 | 12.3 | 29.9 |
|
| |||||||
| Stateline Res, Robertson,nr | 6.6 | 123 | 48 | 6.2 | 116 | 5.4 | 13.9 |
|
| |||||||
| Flaming Gorge Res, Flaming Gorge Dam, At | 3088.1 | 102 | 82 | 3127.5 | 104 | 3015.6 | 3749.0 |
|
| |||||||
| Solider Springs,nr | 785.3 | 119 | 71 | 792.1 | 120 | 660.2 | 1105.9 |
| Starvation Res, Duchesne, Nr | 129.2 | 89 | 78 | 150.9 | 104 | 144.5 | 165.3 |
|
| |||||||
| Upper Stillwater Res | 12.6 | 165 | 40 | 11.2 | 146 | 7.6 | 31.4 |
|
| |||||||
| Moon Lake Res, Mtn Home, Nr | 26.7 | 100 | 73 | 22.8 | 86 | 26.6 | 36.5 |
|
| |||||||
| Red Fleet Res, Vernal, Nr | 21.3 | 115 | 83 | 16.7 | 90 | 18.5 | 25.7 |
|
| |||||||
| Scofield Res, Scofield, Nr | 16.6 | 54 | 25 | 11.9 | 39 | 30.6 | 65.8 |
|
| |||||||
| Joes Vly Res, Orangeville, Nr | 31.0 | 77 | 50 | 36.8 | 92 | 40.2 | 62.5 |
|
| |||||||
| Electric Lake | 16.1 | 86 | 51 | 16.8 | 89 | 18.8 | 31.5 |
|
| |||||||
| TOTAL | 4348.3 | 105 | 76 | 4369.9 | 106 | 4123.0 | 5700.4 |
| Range | Round to | |
| 0-1.99 | 0.01 | |
| 2.0-19.9 | 0.1 | |
| 20-199 | 1.0 | |
| 200-999 | 5.0 | |
| 1000+ | 3 significant digits |