Green Water Supply Outlook, April 1, 2008
Note: This publication is scheduled for revision. If you have feedback on content, format, or publication frequency, please contact us.
Contents
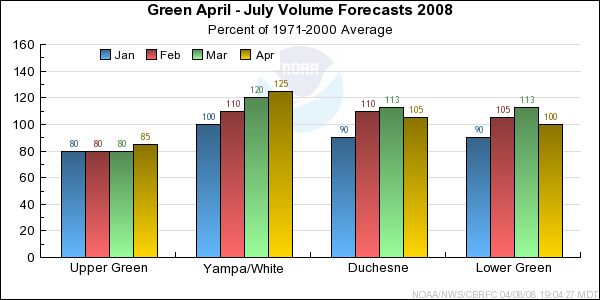
Green Summary
March brought a mix of conditions to the Green River. The Upper portion of the basin had
near average precipitation while the Yampa. Duchesne and Lower Green saw below average to
well below average precipitation. Fortunately, temperatures were cool with daily
maximums 3-7 Fahrenheit degrees below average and minimums 1 to 3 Fahrenheit degrees
below average. This preserved much of the snowpack in the Yampa, Duchense and Lower
Green basins where conditions are still above the April 1st average. In the Upper Basin,
snowpack improved slightly from 90 percent on March first to 95 percent on April 1st.
*Median of forecasts within each basin.
Upper Green Basin Conditions
Near average March precipitation brought the median basin forecast up to 85 percent in
the Upper Green. However, dry soil conditions continue to influence the April through
July Forecast in the Upper Green. While snowpack in near normal at many sites, modeled
soil moisture is well below average with some regions in the 20 to 30 percent of the 30
year average. This accounts for the difference in the snow observations and the April
through July runoff forecast.
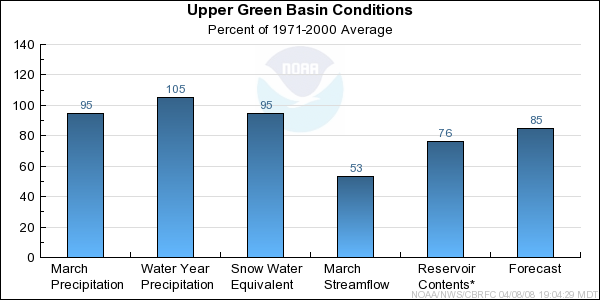
* Percent usable capacity, not percent average contents.
Click for multi-month Graph.
Yampa/White Basin Conditions
March precipitation was only 70 percent average. Basin wide, snowpack remained
110 percent on April 1st. Key stations in portions of the Sierra Madre and Park Range increased snowpack.
As a result, model guidance increased for some points and the median basin forecast is 125 percent.
This increase is seen on the Elk River and Elkhead Creek, which are expected to see April
through July volumes that are much above average.
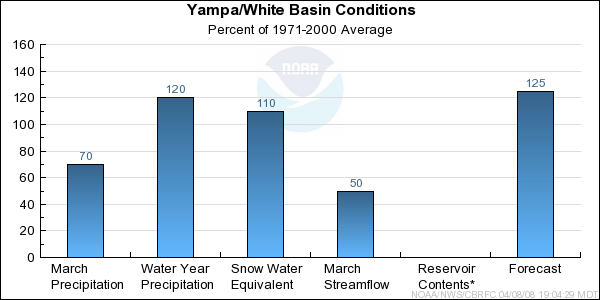
* Percent usable capacity, not percent average contents.
Click for multi-month Graph.
Duchesne Basin Conditions
Below average precipitation in March led to a reduction in forecasted volumes for
points in the Duchesne River Basin. Continued cool temperatures and the potential
for additional storms to impact the area during the first portion of April should
keep runoff volumes near average to slightly above average.
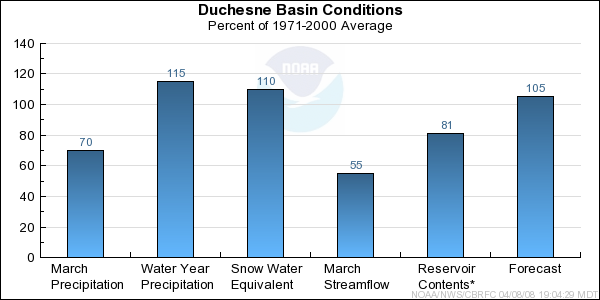
* Percent usable capacity, not percent average contents.
Click for multi-month Graph.
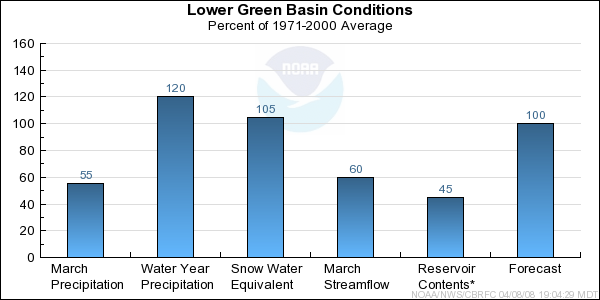
Lower Green Basin Conditions
The Lower Green Basin had the least March precipitation in the region. Snowpack dropped
15% from the March 1st but is still 120% of the April 1st average. Runoff volumes are
anticipated to be near average.
* Percent usable capacity, not percent average contents.
Click for multi-month Graph.
Differences between the full period forecasts and the residual forecasts may not exactly equal the actual observed volumes due to rounding conventions (see Definitions section).
Precipitation Maps


Hydrologist: Ed Clark
