Lower Colorado Water Supply Outlook, March 1, 2008

Note: This publication is scheduled for revision. If you have feedback on content, format, or publication frequency, please contact us.
Prepared by G. Smith
NOAA, National Weather Service
Colorado Basin River Forecast Center
Salt Lake City, Utah
www.cbrfc.noaa.gov

Contents

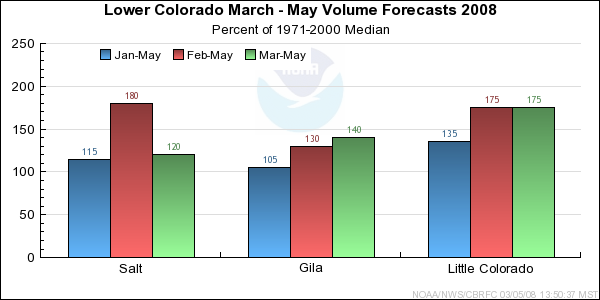
Lower Colorado Summary

Above average precipitation occured in February from northern Arizona extending to just south of the Mogollon Rim. Below average precipitation was observed over the southern third of Arizona. Snow continued to accumulate at the highest elevations through mid February with melt occurring during the last week of the month. Snowmelt combined with rainfall earlier in the month resulting in February streamflow volumes well above median for the third consecutive month. Runoff volumes for the February through May period are expected to range from near 120 to 300 percent of median.


*Median of forecasts within each basin.


Salt Basin Conditions

March through May runoff volumes in the Salt, Verde, and Tonto River Basins are expected to range from near 110 to 120 percent of the median. Rainfall and snowmelt runoff during February contributed to monthly volumes between 300 to 450 percent of median. Snowpack that remains in the highest elevations of the Salt and Verde Basins ranges from 120 to 260 percent of average. The snowpack will contribute to the seasonal runoff volumes but areal coverage extends across a small fraction of the basin. Additional rainfall during the March through May period may contribute significantly to runoff volumes due to saturated conditions in this area.


* Percent usable capacity, not percent average contents.
Click for multi-month Graph.

Gila Basin Conditions

March through May runoff volumes in the Gila River Basin are expected to range from near 120 to 250 percent of median. Monthly runoff volumes in February due to rainfall and snowmelt ranged from 200 to 350 percent of median. Snowpack in the San Francisco Basin high elevations ranges from 90 to 260 percent of average. Additional rainfall during the March through May period may contribute significantly to runoff volumes due to saturated conditions.


* Percent usable capacity, not percent average contents.
Click for multi-month Graph.

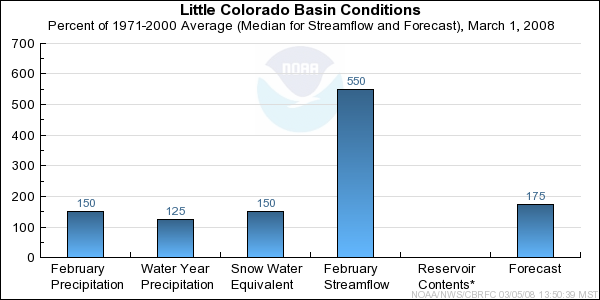
Little Colorado Basin Conditions

March through May runoff volumes in the Little Colorado Basin are expected to range from near 120 to 270 percent of median. Monthly runoff volumes in February due to rainfall and snowmelt ranged from near 370 to near 900 percent of median. Snowpack in the Little Colorado southern headwaters ranges between 140 and 160 percent of average. February precipitation amounts ranged from 130 to 180 percent of average. Additional rainfall during the March through May period may contribute significantly to runoff volumes due to saturated conditions.


* Percent usable capacity, not percent average contents.
Click for multi-month Graph.


Salt Specific Site Forecasts (kaf)

Click site name for graph.
Forecast
Period
90%
Exceedance
Volume
50%
Exceedance
Volume
Percent
Average
10%
Exceedance
Volume
Salt
Roosevelt, Nr March-May172325120550
Tonto Ck
Roosevelt, Nr, Gun Ck, Abv March-May6.93011580
Verde
Blo Tangle Ck, Abv Horsehoe Dam March-May74170118325


Gila Specific Site Forecasts (kaf)

Click site name for graph.
Forecast
Period
90%
Exceedance
Volume
50%
Exceedance
Volume
Percent
Average
10%
Exceedance
Volume
Gila
Gila, Nr March-May254513273
Virden, Nr, Blue Ck, Blo March-May255812391
Solomon, Nr, Head Of Safford Vly March-May42125119260
San Carlos Res, Coolidge Dam, At March-May39100156161
San Francisco
Glenwood, Nr March-May15.93320159
Clifton March-May4372171126
San Pedro
Charleston March-May11.5753.5


Little Colorado Specific Site Forecasts (kaf)

Click site name for graph.
Forecast
Period
90%
Exceedance
Volume
50%
Exceedance
Volume
Percent
Average
10%
Exceedance
Volume
Little Colorado
Lyman Lk, Abv, St. Johns, Nr March-June4.71117521
Woodruff March-May3.462738.6
Rio Nutria
Ramah, Nr March-May0.78414811.5
Zuni
Black Rock Res, Abv March-May122253.5
Cebolla Ck
Ramah Res March-May0.5221345.9
East Clear Ck
Blue Ridge Res, Pine, Nr March-May11.22116435
Clear Ck
Winslow, Nr March-May306320396
Chevelon Ck
Winslow, Nr, Wildcat Cyn, Blo March-May51713035
Walnut Ck
Lake Mary March-May2.251229.5

Differences between the full period forecasts and the residual forecasts may not exactly equal the actual observed volumes due to rounding conventions (see Definitions section).

Lower Colorado Reservoir Contents (kaf)

Usable
Capacity
EOM
Contents
Percent
Usable
Capacity
Last Year
EOM
Last Year
%Capacity
Salt
Roosevelt 1653.0 1452.5 88 1012.0 61
Horse Mesa 245.0 239.2 98 224.0 91
Mormon Flat 58.0 55.3 95 54.0 93
Stewart Mountain 70.0 67.8 97 64.0 91
Horseshoe 109.2 106.4 97 0.0 0
Bartlett 178.0 175.1 98 68.0 38
untitled
TOTAL 2313.2 2096.3 91 1422.0 61
Little Colorado
Lyman Lake 31.0 9.7 31 7.6 25
Bill Williams
Alamo 1045.0 164.0 16 130.0 12
Agua Fria
Lake Pleasant 1145.0 750.9 66 756.0 66
Gila
San Carlos 885.0 358.8 41 281.0 32
Painted Rock 2476.0 0.0 0 0.0 0
Colorado
Lake Powell 24322.0 10880.4 45 11551.8 47
Lake Mead 27380.0 13060.0 48 14302.0 52
Lake Mohave 1810.0 1599.9 88 1642.0 91
Lake Havasu 619.0 614.4 99 538.0 87
untitled
TOTAL 59713.0 27438.0 46 29208.4 49

Precipitation Maps


Definitions

10% exceedance forecast: Given the current hydrometeorological conditions, i.e current snowpack, soil moisture and streamflow, the volume that has a 10% chance of being exceeded. Previously referred to as "Reasonable Maximum Forecast".

50% exceedance forecast: Given the current hydrometeorological conditions, i.e current snowpack, soil moisture and streamflow, the volume that has a 50% chance of being exceeded. Previously referred to as "Most Probable Forecast".

90% exceedance forecast: Given the current hydrometeorological conditions, i.e current snowpack, soil moisture and streamflow, the volume that has a 90% chance of being exceeded. Previously referred to as "Reasonable Minimum Forecast".

Acre-Foot (af): The volume equal to one acre covered one foot deep (43,560 cubic feet). See kaf below.

Average: The arithmetic mean. The sum of the values divided by the number of values. Values from 1971-2000 are used for this publication.

Categories: Much Above Average=Greater than 130%, Above Average=111-130%, Near Average=90-110%, Below Average=70-89%, Much Below Average=Less than 70%.

CBRFC: Colorado Basin River Forecast Center.

Forecast Period: The period from April 1 through July 31, unless otherwise noted.

kaf: Thousand Acre-Feet. See Acre-Foot above.

Inflow: The volume of water that flows into a reservoir or lake.

Median: The middle value of an ordered set of values. Half of the values are higher and half of the values are lower. When the set contains an even number of values the median is the average of the two middle numbers.

NOAA: National Oceanic and Atomospheric Administration.

NWS: National Weather Service.

Rounding Conventions:
RangeRound to
0-1.990.01
2.0-19.90.1
20-1991.0
200-9995.0
1000+3 significant digits


Streamflow: The volume of water that flows past a specific stream site.

Water Year: The 12-month period, October 1 through September 30. The water year is designated by the calendar year in which it ends. Thus, the year ending September 30, 2008, is called the "2008 water year."


Additional Information

Water supply forecasts take into consideration present hydrometeorological conditions and use average basin temperatures and precipitation for the forecast period. As the forecast season progresses, a greater portion of the future hydrologic and climatic uncertainty becomes known and monthly forecasts become more accurate. For more information on the tools we use, consult Water Supply Forecasting Tools.

Volume forecasts represent adjusted flows; that is, observed flows with upstream water use taken into account. Adjusted flows will closely approximate natural or unimpaired flows. However, not all upstream diversions or impoundments are measured or quantifiable. For specific adjustments used with each forecast point, consult the Guide to Water Supply Forecasting.

The Water Supply Outlook is issued monthly January through May by the Colorado Basin River Forecast Center. It represents a coordinated effort between the National Weather Service, Natural Resources Conservation Service, Bureau of Reclamation, U.S. Geological Survey and local water district managers.

Note: Data used in this report are provisional and are subject to revision.

For more information, or to be included on the mailing list, please contact:

Colorado Basin River Forecast Center
2242 W North Temple
Salt Lake City, UT 84116
(801) 524-5130
www.cbrfc.noaa.gov


Hydrologist: G. Smith