Lower Colorado Water Supply Outlook, April 1, 2008

Note: This publication is scheduled for revision. If you have feedback on content, format, or publication frequency, please contact us.
Prepared by G. Smith
NOAA, National Weather Service
Colorado Basin River Forecast Center
Salt Lake City, Utah
www.cbrfc.noaa.gov

Contents

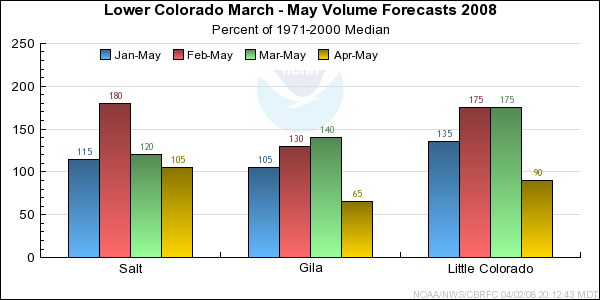
Lower Colorado Summary

March was a very dry month across much of Arizona with many locations receving little or no precipitation. Streamflows, which had been at levels that were much above median throughout the winter months, dropped to below median levels due to drier conditions. Exceptions to this were locations where a significant high elevation snowpack existed which included the Salt, Verde, and southern headwaters of the Lower Colorado drainage. Streamflows in these areas ranged from 120 to almost 300 percent of median. As of early April the only snow that remains existed in protected high elevation locations. Runoff volumes for the April-May period are expected to range from near 60 to 130 percent of median.


*Median of forecasts within each basin.


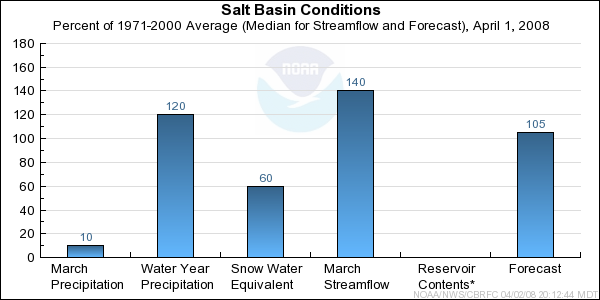
Salt Basin Conditions

April through May runoff volumes near median are expected in the Salt River Basin with volumes in the Tonto and Verde Basins expected to range from 60 to 80 percent of median. Although precipitation was much below average in March the melting of a significant high elevation snowpack contributed to March streamflow volumes that were near 125 percent of median on the Salt River and 220 percent of median on the Verde River. The snowpack in the Tonto drainage had been depeleted earlier and the March streamflow volume was near 80 percent of median. Snowpack that remains in the White Mountains of the Upper Salt Basin is limited to the highest elevations and was near 60 percent of average as of April 1st.


* Percent usable capacity, not percent average contents.
Click for multi-month Graph.

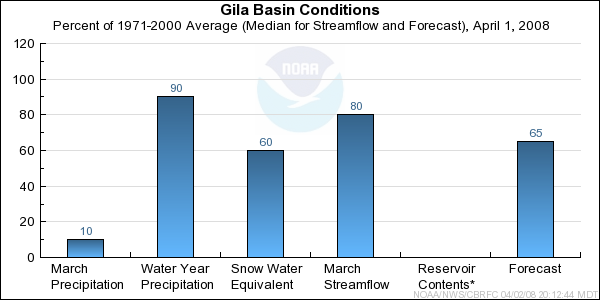
Gila Basin Conditions

April through May runoff volumes in the Gila River Basin are expected to range from near 60 to 85 percent of median. Monthly runoff volumes in March reflected the dry conditions of the month. March volumes in the upper Gila were near 60 percent of median. Much above average snowpack in the San Francisco drainage melted off and contributed to March volumes near 100 to 110 percent of the historical median. Rivers in the Gila are now in their seasonal decline.


* Percent usable capacity, not percent average contents.
Click for multi-month Graph.

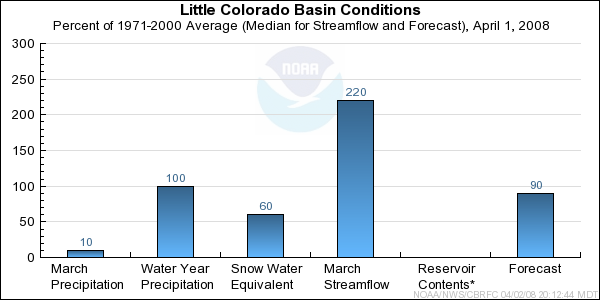
Little Colorado Basin Conditions

April through May runoff volumes in the Little Colorado Basin are expected to range from near 90 to 120 percent of median. Above median streamflow volumes were observed during March despite much below average precipitation. This was due to the melt of high elevation snowpack. Some snow still remains at highest elevations however it was melting off quickly. Streams have been running above median as of late March and early April due to recent snow melt. In the absence of any additional rain events Little Colorado Basin rivers will be in their seasonal decline within the next 1-2 weeks.


* Percent usable capacity, not percent average contents.
Click for multi-month Graph.


Salt Specific Site Forecasts (kaf)

Click site name for graph.
Forecast
Period
90%
Exceedance
Volume
50%
Exceedance
Volume
Percent
Median
10%
Exceedance
Volume
Salt
Roosevelt, Nr April-May114165115230
Tonto Ck
Roosevelt, Nr, Gun Ck, Abv April-May2.86.57712.6
Verde
Blo Tangle Ck, Abv Horsehoe Dam April-May17.9327352


Gila Specific Site Forecasts (kaf)

Click site name for graph.
Forecast
Period
90%
Exceedance
Volume
50%
Exceedance
Volume
Percent
Median
10%
Exceedance
Volume
Gila
Gila, Nr April-May6.9126919.1
Virden, Nr, Blue Ck, Blo April-May7135427
Solomon, Nr, Head Of Safford Vly April-May15266250
San Carlos Res, Coolidge Dam, At April-May3138437
San Francisco
Glenwood, Nr April-May2.667711.6
Clifton April-May6147623
San Pedro
Charleston April-May0.330.7601.1


Little Colorado Specific Site Forecasts (kaf)

Click site name for graph.
Forecast
Period
90%
Exceedance
Volume
50%
Exceedance
Volume
Percent
Median
10%
Exceedance
Volume
Little Colorado
Lyman Lk, Abv, St. Johns, Nr April-June1.84.51059.1
Woodruff April-May0.080.5601.6
Rio Nutria
Ramah, Nr April-May0.040.3580.98
Zuni
Black Rock Res, Abv April-May0.010.4631.9
Cebolla Ck
Ramah Res April-May00.2690.52
East Clear Ck
Blue Ridge Res, Pine, Nr April-May1.14.59211.7
Clear Ck
Winslow, Nr April-May5189050
Chevelon Ck
Winslow, Nr, Wildcat Cyn, Blo April-May1.14.88412
Walnut Ck
Lake Mary April-May0.71.4962.4

Differences between the full period forecasts and the residual forecasts may not exactly equal the actual observed volumes due to rounding conventions (see Definitions section).

Lower Colorado Reservoir Contents (kaf)

Usable
Capacity
EOM
Contents
Percent
Usable
Capacity
Last Year
EOM
Last Year
%Capacity
Salt
Roosevelt 1653.0 1616.7 98 10230.0 619
Horse Mesa 245.0 235.5 96 223.0 91
Mormon Flat 58.0 55.5 96 55.0 95
Stewart Mountain 70.0 64.5 92 66.0 94
Horseshoe 109.2 108.6 99 0.0 0
Bartlett 178.0 178.0 100 75.0 42
untitled
TOTAL 2313.2 2258.9 98 10649.0 460
Little Colorado
Lyman Lake 31.0 15.8 51 8.3 27
Bill Williams
Alamo 1045.0 161.8 15 130.0 12
Agua Fria
Lake Pleasant 1145.0 1046.9 91 766.0 67
Gila
San Carlos 885.0 367.5 42 279.0 32
Painted Rock 2476.0 0.0 0 0.0 0
Colorado
Lake Powell 24322.0 10799.7 44 11636.9 48
Lake Mead 27380.0 12940.0 47 14021.0 51
Lake Mohave 1810.0 1617.8 89 1649.0 91
Lake Havasu 619.0 551.3 89 563.0 91
untitled
TOTAL 59713.0 27500.7 46 29053.2 49

Precipitation Maps


Definitions

10% exceedance forecast: Given the current hydrometeorological conditions, i.e current snowpack, soil moisture and streamflow, the volume that has a 10% chance of being exceeded. Previously referred to as "Reasonable Maximum Forecast".

50% exceedance forecast: Given the current hydrometeorological conditions, i.e current snowpack, soil moisture and streamflow, the volume that has a 50% chance of being exceeded. Previously referred to as "Most Probable Forecast".

90% exceedance forecast: Given the current hydrometeorological conditions, i.e current snowpack, soil moisture and streamflow, the volume that has a 90% chance of being exceeded. Previously referred to as "Reasonable Minimum Forecast".

Acre-Foot (af): The volume equal to one acre covered one foot deep (43,560 cubic feet). See kaf below.

Average: The arithmetic mean. The sum of the values divided by the number of values. Values from 1971-2000 are used for this publication.

Categories: Much Above Average=Greater than 130%, Above Average=111-130%, Near Average=90-110%, Below Average=70-89%, Much Below Average=Less than 70%.

CBRFC: Colorado Basin River Forecast Center.

Forecast Period: The period from April 1 through July 31, unless otherwise noted.

kaf: Thousand Acre-Feet. See Acre-Foot above.

Inflow: The volume of water that flows into a reservoir or lake.

Median: The middle value of an ordered set of values. Half of the values are higher and half of the values are lower. When the set contains an even number of values the median is the average of the two middle numbers.

NOAA: National Oceanic and Atomospheric Administration.

NWS: National Weather Service.

Rounding Conventions:
RangeRound to
0-1.990.01
2.0-19.90.1
20-1991.0
200-9995.0
1000+3 significant digits


Streamflow: The volume of water that flows past a specific stream site.

Water Year: The 12-month period, October 1 through September 30. The water year is designated by the calendar year in which it ends. Thus, the year ending September 30, 2008, is called the "2008 water year."


Additional Information

Water supply forecasts take into consideration present hydrometeorological conditions and use average basin temperatures and precipitation for the forecast period. As the forecast season progresses, a greater portion of the future hydrologic and climatic uncertainty becomes known and monthly forecasts become more accurate. For more information on the tools we use, consult Water Supply Forecasting Tools.

Volume forecasts represent adjusted flows; that is, observed flows with upstream water use taken into account. Adjusted flows will closely approximate natural or unimpaired flows. However, not all upstream diversions or impoundments are measured or quantifiable. For specific adjustments used with each forecast point, consult the Guide to Water Supply Forecasting.

The Water Supply Outlook is issued monthly January through May by the Colorado Basin River Forecast Center. It represents a coordinated effort between the National Weather Service, Natural Resources Conservation Service, Bureau of Reclamation, U.S. Geological Survey and local water district managers.

Note: Data used in this report are provisional and are subject to revision.

For more information, or to be included on the mailing list, please contact:

Colorado Basin River Forecast Center
2242 W North Temple
Salt Lake City, UT 84116
(801) 524-5130
www.cbrfc.noaa.gov


Hydrologist: G. Smith