Lake Powell Water Supply Outlook, February 1, 2008
Note: This publication is scheduled for revision. If you have feedback on content, format, or publication frequency, please contact us.
Contents
Lake Powell Sub-Basin Summaries
The Green River Basin continues to have a wide distribution of water supply outlook conditions.
Storm patterns favored the basin below Flaming Gorge helping to increase the forecast for those areas.
Conditions upstream from Flaming Gorge continue to be below average.
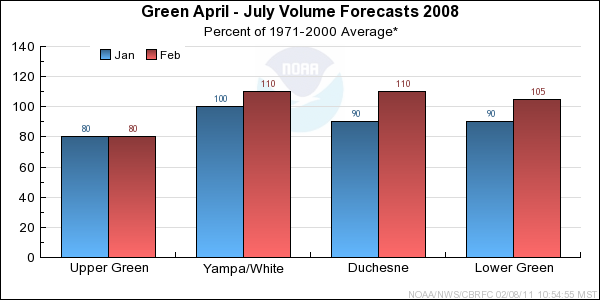
*Median of forecasts within each basin.
Although the January percent of average monthly precipitation was not quite as
high as December, it was still much above average across the Upper Colorado
Basin. As a result, the February 1 snow water equivalent percent of average
values rose 15% in the Upper Colorado mainstem and 30% in the Gunnison and
Dolores basins from the January 1 values. Forecasts of the April through July
runoff volumes rose 10% to 40% from those issued January 1.
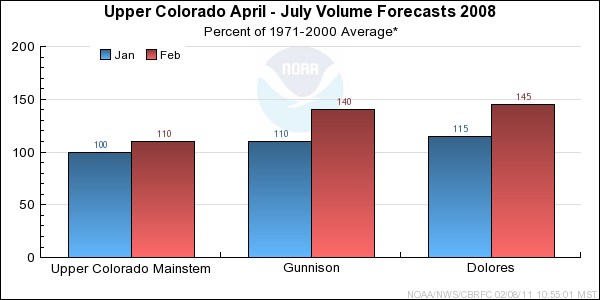
*Median of forecasts within each basin.
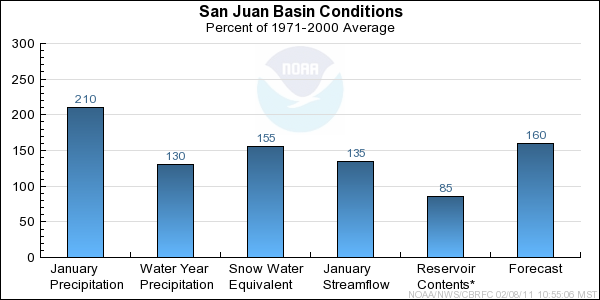
Last month's streamflows were average to above average across the San Juan Basin. Some
notables were Vallecito inflow of 125% and San Juan near Bluff with 135%. Last month's
precipitation was much above average with 210%. The seasonal precipitation was above
average with 130%. The snowpack across the entire basin as of February 1st increased
from 130% to 155% of average. On February 1st, snowpack in the Upper San Juan Basin was
particularly high with 170% of average while the Animas Basin was 150%. The storm
totals from February 1st through the 4th was factored into the streamflow forecast.
Northwest flow will continue across the San Juan Basin into early next week with most
of the moisture forecast to stay north. The streamflow forecast was increased
for all of the forecast points this month due to the increase in snowpack over the
entire San Juan Basin.
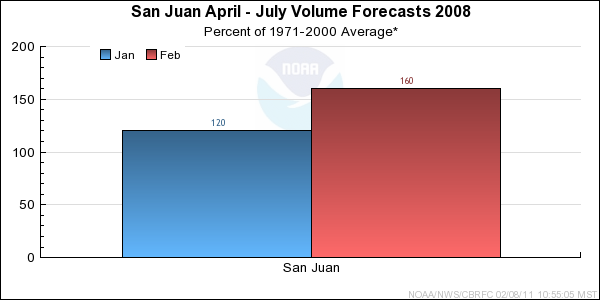
*Median of forecasts within each basin.
Upper Green Basin Conditions
January precipitation was above average at 115%. This brings the seasonal precipitation to
near average conditions throughout many basins. However, the snowpack remains below average
at 80% basin wide. The below average soil moisture states within the model continue to
decrease objective guidance values. While NOAA's Climate Prediction Center indicates the
potential for wetter than normal conditions over the next 30 days, shorter term weather
models do not indicate significant precipitation in the Upper Green River Basin over the next 10 days.
This influenced the decrease in the coordinated forecast for many points. Like December, monthly inflow to
Flaming Gorge was near 50% of average.
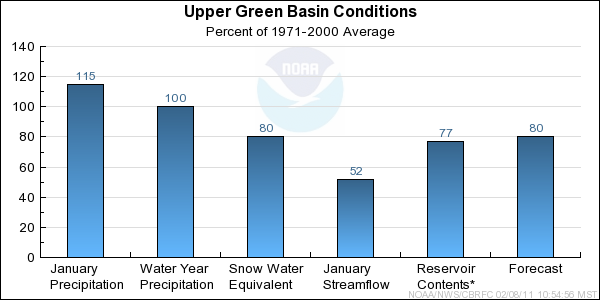
* Percent usable capacity, not percent average contents.
Click for multi-month Graph.
Yampa/White Basin Conditions
Monthly precipitation for January was 145% of average in the Yampa River basin. Snowpack increased
from 85% of basin average on January 1, to 110% on February 1. The Elk and Little Snake drainages show the
best conditions with some stations near their seasonal maximum. Due to these improved conditions,
forecasts increased throughout the Yampa and White Basins.

* Percent usable capacity, not percent average contents.
Click for multi-month Graph.
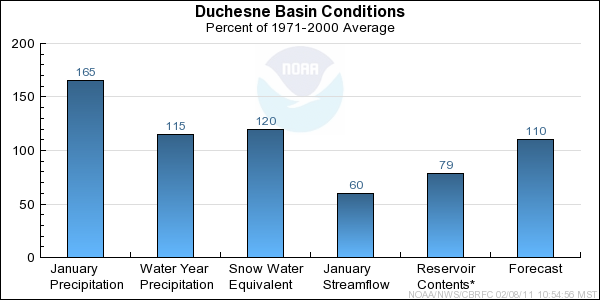
Duchesne Basin Conditions
January precipitation was 165 % of average. The snowpack, which had high variability at the end of December,
has increase to 120% of average as of February 1. All stations within the Uinta Basin have average to above
average conditions. As a result, forecasts increased throughout the basin.
* Percent usable capacity, not percent average contents.
Click for multi-month Graph.
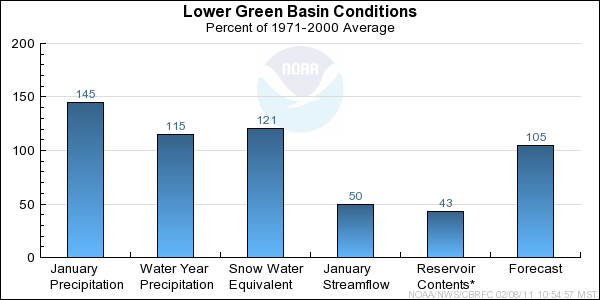
Lower Green Basin Conditions
Similar to the Yampa and Duchesne, January precipitation has brought the snow pack from below average
to above average conditions in the Lower Green. Basin wide, snow pack is 120% of average as of February 1.
As one would expect, forecasts for the Eastern side of the Wasatch Plateau increased to a basin median of 105%.
It's worth noting that monthly precipitation reported by lower elevation gages in the San Rafael Swell region was below average for January. However,
this area does not normally contribute substantial snow melt volume to forecast points within the Lower Green Basin.
* Percent usable capacity, not percent average contents.
Click for multi-month Graph.
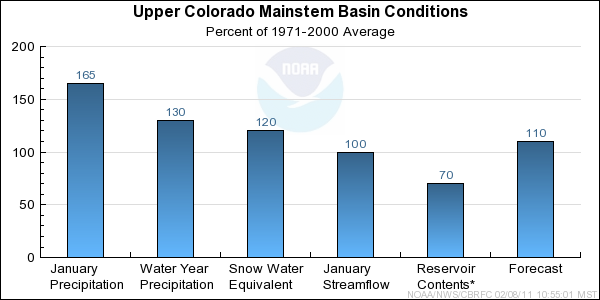
Upper Colorado Mainstem Basin Conditions
January was another wet month in the Upper Colorado mainstem with 165% of the
basin average precipitation. This brought the seasonal precipitation to
130% of average and the snow water equivalent to 120% of average as of February
1st. However, the snowpack is not uniform across the basin. The Roaring Fork
and Plateau Creek basins represent the high end of the spectrum with close to
150% of average snow water equivalent, while the basins above Kremmling
generally have between 100% and 115% of average snow water equivalent. Because
of the great gains in the snowpack all forecasts increased from last month,
with the Roaring Fork and Plateau Creek points changing the most. The April
through July streamflow forecasts now range between 100% and 130% of average.
* Percent usable capacity, not percent average contents.
Click for multi-month Graph.
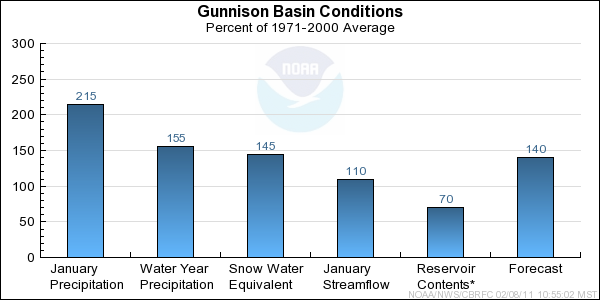
Gunnison Basin Conditions
Above average precipitation continued in the Gunnison Basin for the month of
January with the basin receiving 215% of the monthly average. The basin is now
at 155% of the seasonal average as of February 1st. All SNOTEL gages in the
basin are now above 70% of their average seasonal maximum snowpack accumulation.
Three SNOTELs, Overland Res. (127%), Park Cone (111%), and Columbine Pass (111%),
have already accumulated over 100% of their average seasonal maximum snowpack.
Even though precipitation was above normal for January, streamflow remains
around average since most precipitation fell as snow. April through July volume
forecasts have increased because of the above average snow fall. Volume
forecasts now range from 131% of average at Taylor Park Reservoir to 152% of
average at Paonia Reservoir.
* Percent usable capacity, not percent average contents.
Click for multi-month Graph.
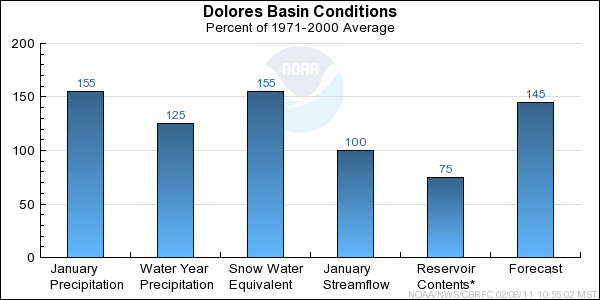
Dolores Basin Conditions
Monthly precipitation in the Dolores Basin for January was above normal. The
precipitation total was not as impressive as December but still much above
average at 155% of the monthly average. Seasonal precipitation is now at 125%
as of February 1st. All SNOTEL gages in the Dolores are above 80% of their
average seasonal maximum snowpack accumulation. Scotch Creek (105%) and Lizard
Head Pass (105%) are already above 100% of their average seasonal maximum
snowpack accumulation. Even though precipitation was above normal for January,
streamflow remains around average since most precipitation fell as snow. April
through July volume forecasts have increased because of the above average snow
fall. Volume forecasts now range from 136% of average on the San Miguel River
at Placerville to 159% of average on the Dolores River at Cisco.
* Percent usable capacity, not percent average contents.
Click for multi-month Graph.
San Juan Basin Conditions
* Percent usable capacity, not percent average contents.
Click for multi-month Graph.
Differences between the full period forecasts and the residual forecasts may not exactly equal the actual observed volumes due to rounding conventions (see Definitions section).
Precipitation Maps


