Lake Powell Water Supply Outlook, March 1, 2008
Note: This publication is scheduled for revision. If you have feedback on content, format, or publication frequency, please contact us.
Contents
Lake Powell Sub-Basin Summaries
Regional Summary
The Green River basin continues show variability in water supply outlook conditions.
While the entire basin has received normal to above normal season precipitation,
snowpack ranges from below average to above average.
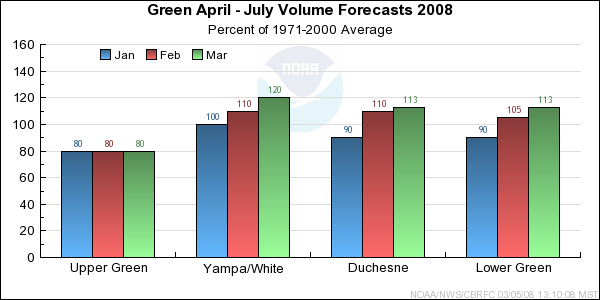
*Median of forecasts within each basin.
February was yet another month of above average precipitation across the Upper
Colorado Basin. This increased the snow water equivalent 5% to 10% from
February 1st to March 1st in the Dolores, Gunnison, and Upper Colorado
mainstem basins. As a result, median forecasts in each basin rose 10% for the
April through July runoff period.
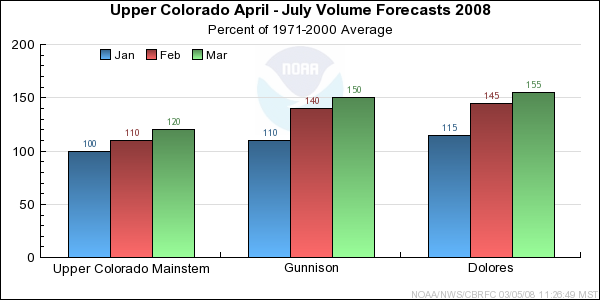
*Median of forecasts within each basin.
-Model Soil Moisture/Observed Streamflow...Soil moisture for all of the sub-basins in the San Juan
are near normal for the upper portions. However, soil moisture conditions were much above
average for the middle and lower portions of the sub-basins in the San Juan. Observed streamflow
was below average for the headwaters of the San Juan, while the lower portions of the San Juan were
above average.
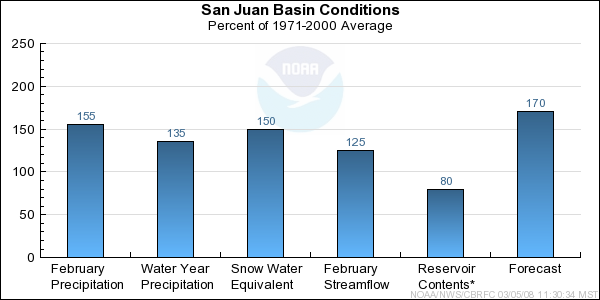
-Snowpack/Precipitation...Snowpack above Navajo Reservoir remained high at 160 percent of average
while the Animas and the entire San Juan Basin was 150 percent. Precipitation over the San Juan
Basin was 155 percent of average with a seasonal average of 135 percent. The extreme was above
Navajo Reservoir which received 170 percent of average for the month of February and a seasonal
average of 155 percent.
-Short Term Precipitation Forecast...The forecast models through five days keep the San Juan Basin relatively dry
with above average temperatures into the beginning of next week.
-General Discussion...The current snowpack along with both statistical forecast and ESP numbers
suggest raising the forecast across some of the headwaters of the San Juan. The CPC guidance
continues to show the possibility of increased chances of below normal precipitation for
March through May across the San Juan Basin. However, CPC has been forecasting below average
precipitation for the San Juan, and so far the dry forecast has not verified.
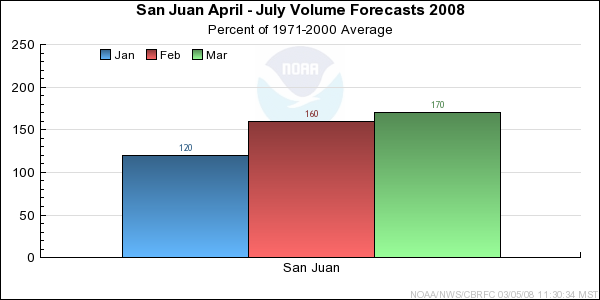
*Median of forecasts within each basin.
Upper Green Basin Conditions
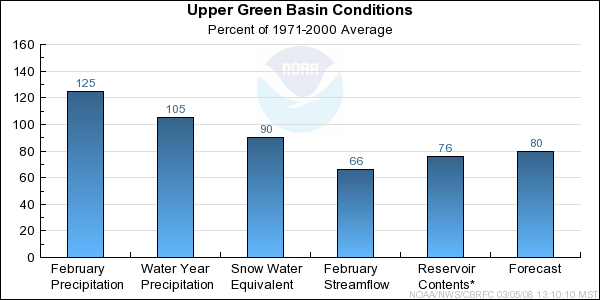
Despite above average precipitation in February, and near average seasonal
precipitation for the water year, snow pack remains below average at 85 percent
of the conditions on March 1st. Forecast for points in the Upper Green
are lower and reflect the very dry soil condition upstream of Flaming
Gorge. Model soil moisture states range from 60% to 15% of average for early March.
This carryover from many years of below average runoff is not
included in statistical guidance, but is responsible for a significantly
lower guidance value from ESP. This is the NWS preferred values. Through the
coordination process this was countered by higher NRCS preferred values. As a
result, the majority of coordinated forecasts were not changed in the Upper Basin
from February 1st.
* Percent usable capacity, not percent average contents.
Click for multi-month Graph.
Yampa/White Basin Conditions
The outlook for spring runoff in the Yampa and White continues to be above average.
February precipitation was nearly 175% of average and brought the snowpack from
110% of average to nearly 115 % of the March 1st average. Model soil moisture
conditions in the Yampa and White are near average and suggest a much more
favorable melt scenario than in the Upper Green. Meteorologic models indicate some
storm activity through the middle of the month which should preserve and increase
snowpack.

* Percent usable capacity, not percent average contents.
Click for multi-month Graph.
Duchesne Basin Conditions
Throughout February, snowpack continued to build throughout the Duchesne River
Basin. Seasonal precipitation is near 130% of normal. In the headwaters, soil
moisture conditions are near average for March 1st. All of these factors combine to
indicate a potentially above average runoff for 2007.
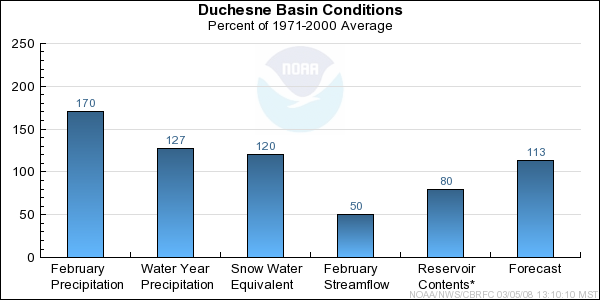
* Percent usable capacity, not percent average contents.
Click for multi-month Graph.
Lower Green Basin Conditions
Similar to the Yampa and Duchesne basins, February precipitation was near 170
percent of average with seasonal precipitation now 135% of average. Lower than
normal accumulation amounts at some stations in the latter half of February resulted
in a slight decrease in the March 1st percent of average snowpack. However,
conditions still indicate that water supply should be near to above average for points
within the Price, and San Rafael drainages.
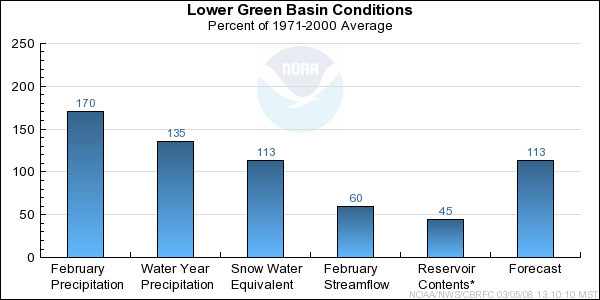
* Percent usable capacity, not percent average contents.
Click for multi-month Graph.
Upper Colorado Mainstem Basin Conditions
The percent of snow water equivalent in the Upper Colorado mainstem basin
increased 10% from February 1st to March 1st due to yet another month of much
above average precipitation. February precipitation was 150% of average, which
brought the seasonal total to 135% and snow water equivalent to 130% of average.
The snow remains highest in the Roaring Fork basin with over 150% of average.
Model soil moisture is near to just below average at this time and streamflow
was near average during February. Due to the increases in snow water
equivalent all forecasts increased from last month. The April through July
streamflow forecasts now range between 100% and 140% of average.
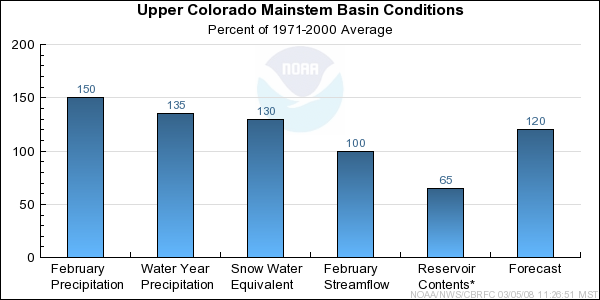
* Percent usable capacity, not percent average contents.
Click for multi-month Graph.
Gunnison Basin Conditions
In February, the Gunnison Basin once again received above average monthly precipitation at 165% of average. All SNOTEL gages in the basin, except Mesa Lakes and Park Reservoir, are now above their average seasonal maximum snowpack accumulation. The snowpack accumulation season on average continues into the beginning of April. In addition, the current percent of average snow water equivalent in the basin increased by 10% since February 1st.
Streamflow for February remained slightly above average at 110%. Modeled soil moisture conditions in the Gunnison basin are slightly below average, except in the headwater areas of the Uncompaghre were modeled soil moisture is slightly above average. With another month of above average precipitation, the April through July volume forecasts have increased slightly or stayed the same as last month. Volume forecasts now range from 135% of average at Taylor Park Reservoir to 162% of average at Paonia Reservoir.
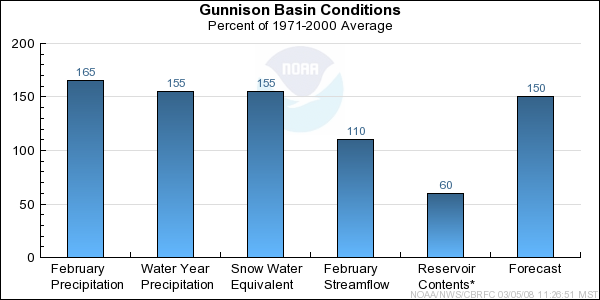
* Percent usable capacity, not percent average contents.
Click for multi-month Graph.
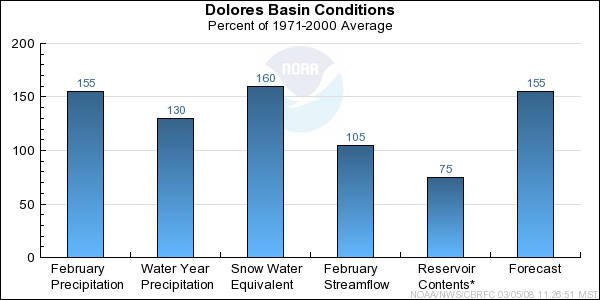
Dolores Basin Conditions
Monthly precipitation was once again above average in the Dolores Basin at 155% of average. The current March 1st percent of average snow water equivalent in the basin increased by 5% since February 1st. Also, all the SNOTEL gages located in the headwater area of the Dolores Basin are now over 110% of average seasonal maximum snowpack accumulation. The snowpack accumulation season on average continues into the beginning of April.
Streamflow in the Dolores Basin for February was just above average at 105%. Modeled soil moisture conditions are around average for the Dolores Basin. With the above average precipitation in February, the April through July volume forecasts in the Dolores Basin have been increased. The forecast at McPhee Reservoir is now at 500 kaf, this is 156% of average. The highest April through July runoff volume on record at McPhee reservoir is 524 kaf.
* Percent usable capacity, not percent average contents.
Click for multi-month Graph.
San Juan Basin Conditions
* Percent usable capacity, not percent average contents.
Click for multi-month Graph.
Differences between the full period forecasts and the residual forecasts may not exactly equal the actual observed volumes due to rounding conventions (see Definitions section).
Precipitation Maps


