Lake Powell Water Supply Outlook, April 1, 2008
Note: This publication is scheduled for revision. If you have feedback on content, format, or publication frequency, please contact us.
Contents
Lake Powell Sub-Basin Summaries
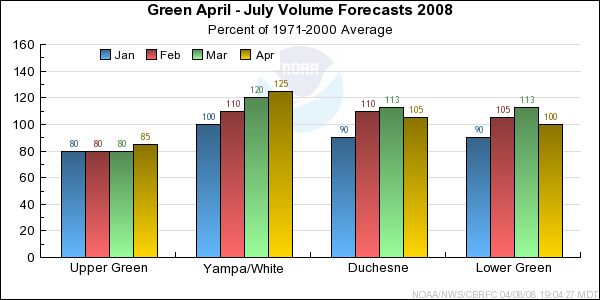
March brought a mix of conditions to the Green River. The Upper portion of the basin had
near average precipitation while the Yampa. Duchesne and Lower Green saw below average to
well below average precipitation. Fortunately, temperatures were cool with daily
maximums 3-7 Fahrenheit degrees below average and minimums 1 to 3 Fahrenheit degrees
below average. This preserved much of the snowpack in the Yampa, Duchense and Lower
Green basins where conditions are still above the April 1st average. In the Upper Basin,
snowpack improved slightly from 90 percent on March first to 95 percent on April 1st.
*Median of forecasts within each basin.
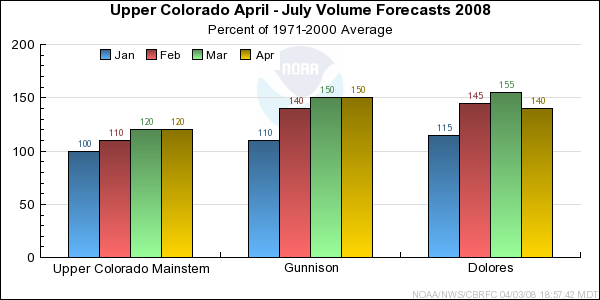
March was a much drier month than we have seen so far this winter in the Upper
Colorado Basin, especially in the Dolores River Basin which received just 35%
of average precipitation during March. The headwaters of the Gunnison and
Upper Colorado mainstem basins received close to normal precipitation for the
month, while the rest of the areas in those basins received between 40% and
80% of average precipitation. As a result, median forecasts for the April
through July runoff volumes dropped 15% in the Dolores Basin and remained
steady in the Gunnison and Upper Colorado mainstem basins.
*Median of forecasts within each basin.
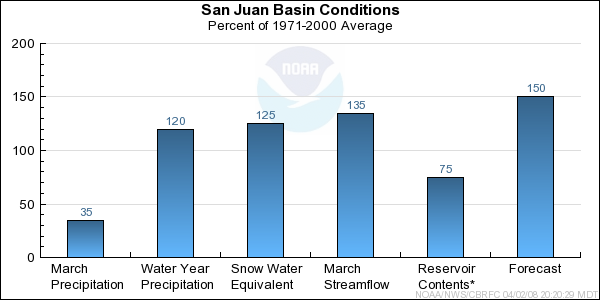
-Model Soil Moisture/Observed Streamflow...Soil moisture for all of the upper basins in the San Juan
are near normal. However, soil moisture conditions were above average for the lower portions of the
San Juan. Observed streamflow for the month of March was above average for the headwaters of the
San Juan, while the lower portions of the San Juan were much above average.
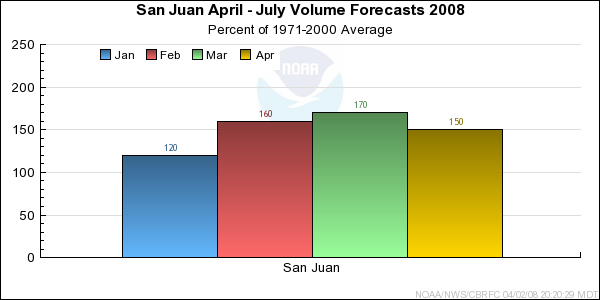
-Snowpack/Precipitation...Snowpack above Navajo Reservoir dropped to 130 percent of average
while the Animas and the entire San Juan Basin dropped to 125 percent. Precipitation over the San Juan
Basin for March was much below average with 35 percent. Seasonal average precipitation for the San Juan
Basin dropped to 120 percent.
-Short Term Precipitation Forecast...The forecast models through five days keep the San Juan Basin
relatively dry with near average temperatures into the beginning of next week.
-General Discussion...The current snowpack along with both statistical forecast and ESP numbers
suggest lowering the forecast across all of the headwaters of the San Juan. The CPC guidance
continues to show the possibility of increased chances of below normal precipitation for
April through June across the San Juan Basin.
*Median of forecasts within each basin.
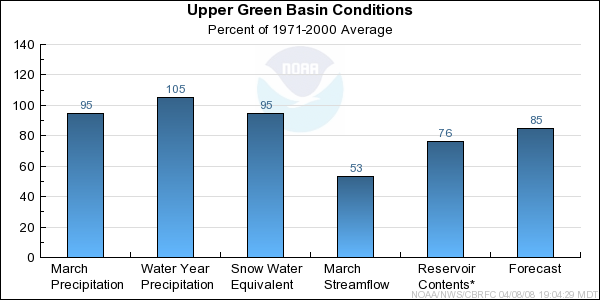
Upper Green Basin Conditions
Near average March precipitation brought the median basin forecast up to 85 percent in
the Upper Green. However, dry soil conditions continue to influence the April through
July Forecast in the Upper Green. While snowpack in near normal at many sites, modeled
soil moisture is well below average with some regions in the 20 to 30 percent of the 30
year average. This accounts for the difference in the snow observations and the April
through July runoff forecast.
* Percent usable capacity, not percent average contents.
Click for multi-month Graph.
Yampa/White Basin Conditions
March precipitation was only 70 percent average. Basin wide, snowpack remained
110 percent on April 1st. Key stations in portions of the Sierra Madre and Park Range increased snowpack.
As a result, model guidance increased for some points and the median basin forecast is 125 percent.
This increase is seen on the Elk River and Elkhead Creek, which are expected to see April
through July volumes that are much above average.
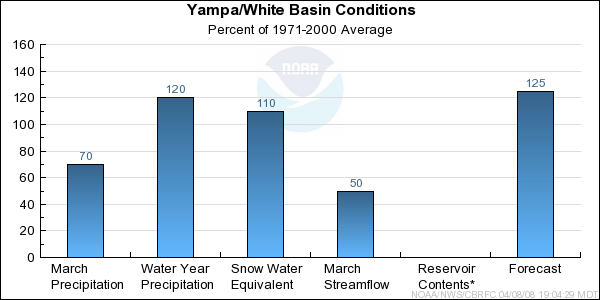
* Percent usable capacity, not percent average contents.
Click for multi-month Graph.
Duchesne Basin Conditions
Below average precipitation in March led to a reduction in forecasted volumes for
points in the Duchesne River Basin. Continued cool temperatures and the potential
for additional storms to impact the area during the first portion of April should
keep runoff volumes near average to slightly above average.
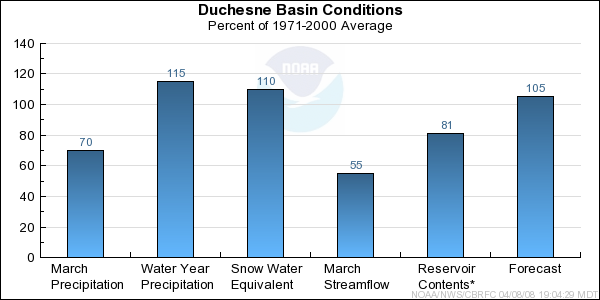
* Percent usable capacity, not percent average contents.
Click for multi-month Graph.
Lower Green Basin Conditions
The Lower Green Basin had the least March precipitation in the region. Snowpack dropped
15% from the March 1st but is still 120% of the April 1st average. Runoff volumes are
anticipated to be near average.
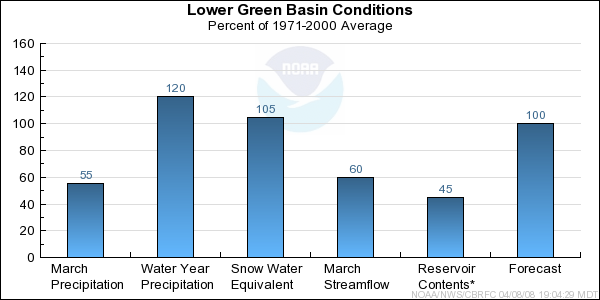
* Percent usable capacity, not percent average contents.
Click for multi-month Graph.
Upper Colorado Mainstem Basin Conditions
The Upper Colorado mainstem basin as a whole received about 85% of the average March
precipitation, but this was not distributed uniformly across the basin. The
headwaters on the southern side of the basin above Glenwood Springs received
near normal precipitation for the month while areas below this received closer
to 50% of average precipitation. Temperatures were a bit on the cool side for
the month overall, as they have been for most of the winter. As a result of
these near normal precipitation and temperature conditions in the higher
elevations during March, the snow water equivalent remained above normal for
this time of year at 125% of average on April 1st; this is only a 5% drop from
the March 1st percent of average. The Roaring Fork basin snow water equivalent
remains the highest in the basin at close to 150% of average. Model soil
moisture is still near to just below average at this time as the runoff gets
ready to start. Current meteorological models are indicating a chance for
continued unsettled weather during the first half of April over western
Colorado. If this occurs, there is potential for additional snowpack
accumulation, or at the very least little loss of snowpack due to melt.
With all this in mind, there were minimal changes made to the forecasts from
last month with just a few points in the Eagle and Roaring Fork basins, as
well as affected downstream points, being raised slightly. The April through
July streamflow forecasts now range between 100% and 150% of average.
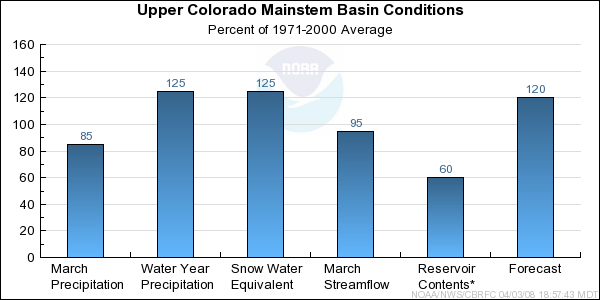
* Percent usable capacity, not percent average contents.
Click for multi-month Graph.
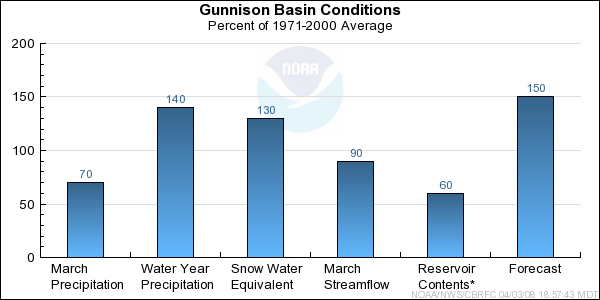
Gunnison Basin Conditions
Precipitation in the Gunnison Basin varied for the month of March. In the northeast portions of the basin, precipitation was around average. For the rest of the basin, precipitation was below average. April 1st percent of average snow water equivalent in the Gunnison Basin ranges from 105% to 160%. On average, this is a 10% reduction from the March 1st percent of average snow water equivalent. However, overall the snowpack is 130% above the average seasonal maximum accumulation.
Streamflow in the Gunnison Basin was 90% of normal for March. Modeled soil moisture states are around average, except for the North Fork of the Gunnison which is below average. April through July volume forecasts in the Gunnison Basin remained steady except for East River and Gunnison River at Gunnison, where there was a slight increase, and Paonia Reservoir, where there was a slight decrease. Volume forecasts range from 135% to 160% of average.
* Percent usable capacity, not percent average contents.
Click for multi-month Graph.
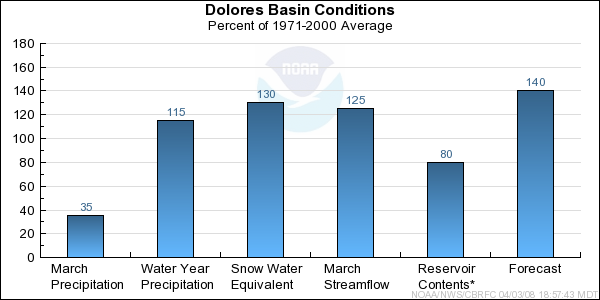
Dolores Basin Conditions
The Dolores Basin saw monthly precipitation well below average for March. April 1st percent of average snow water equivalent in the Dolores ranges from 110% to 140%. This is a 30% reduction from March 1st percent of average snow water equivalent. However, the cool temperatures in March allowed the snowpack to remain higher than the average seasonal maximum accumulation at 120%.
Streamflow in the Dolores Basin was 125% of average for March. Modeled soil moisture conditions in the basin remain around average. With the well below average precipitation for March, the April through July volume forecasts in the Dolores Basin have been reduced. The forecast for McPhee Reservoir is now 450 kaf. However, this is still above the average of 320 kaf. Volume forecasts in the Dolores Basin range from 135% to 150% of average.
* Percent usable capacity, not percent average contents.
Click for multi-month Graph.
San Juan Basin Conditions
* Percent usable capacity, not percent average contents.
Click for multi-month Graph.
Differences between the full period forecasts and the residual forecasts may not exactly equal the actual observed volumes due to rounding conventions (see Definitions section).
Precipitation Maps


