New 1991-2020 Averages being used this year.
Lake Powell Water Supply Outlook, April 1, 2022

Lake Powell Water Supply Outlook, April 1, 2022

Note: This publication is scheduled for revision. If you have feedback on content, format, or publication frequency, please contact us.
Prepared by Ashley Nielson
NOAA, National Weather Service
Colorado Basin River Forecast Center
Salt Lake City, Utah
www.cbrfc.noaa.gov

Contents

Lake Powell Sub-Basin Summaries


*Median of forecasts within each basin.


*Median of forecasts within each basin.


*Median of forecasts within each basin.


Upper Green Basin Conditions


Snow Water Equivalent in Percent of Median.
* Percent usable capacity, not percent average contents.
Click for multi-month Graph.

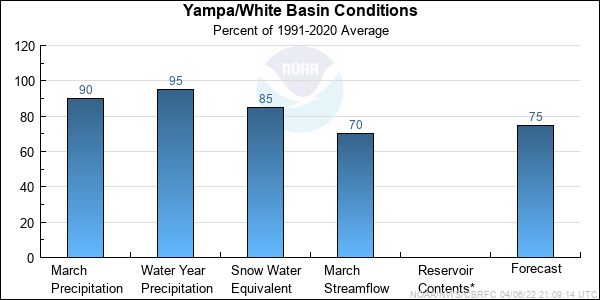
Yampa/White Basin Conditions


Snow Water Equivalent in Percent of Median.
* Percent usable capacity, not percent average contents.
Click for multi-month Graph.

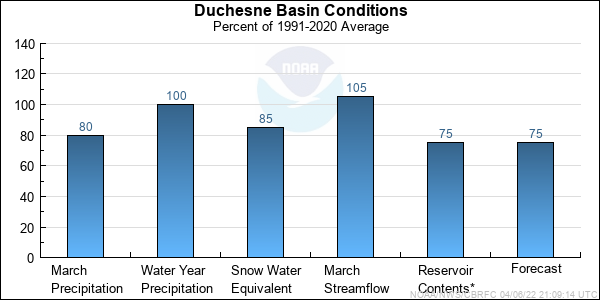
Duchesne Basin Conditions


Snow Water Equivalent in Percent of Median.
* Percent usable capacity, not percent average contents.
Click for multi-month Graph.

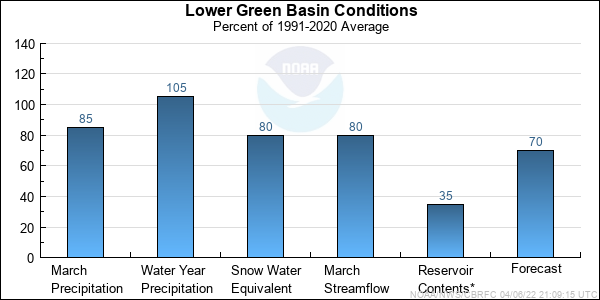
Lower Green Basin Conditions


Snow Water Equivalent in Percent of Median.
* Percent usable capacity, not percent average contents.
Click for multi-month Graph.

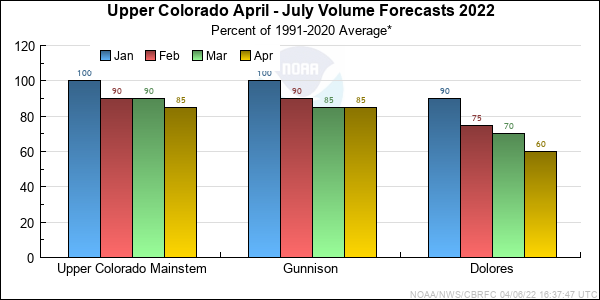
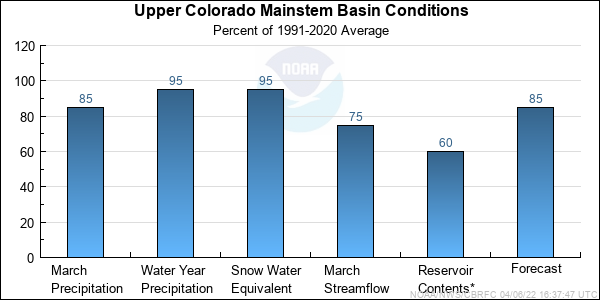
Upper Colorado Mainstem Basin Conditions


Snow Water Equivalent in Percent of Median.
* Percent usable capacity, not percent average contents.
Click for multi-month Graph.

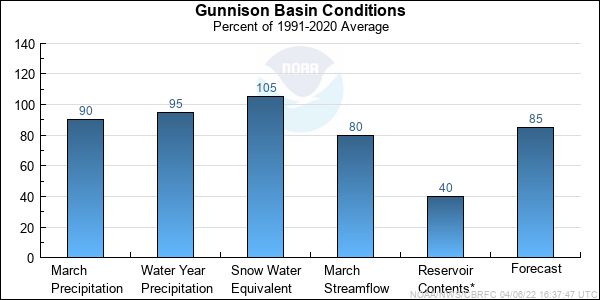
Gunnison Basin Conditions


Snow Water Equivalent in Percent of Median.
* Percent usable capacity, not percent average contents.
Click for multi-month Graph.

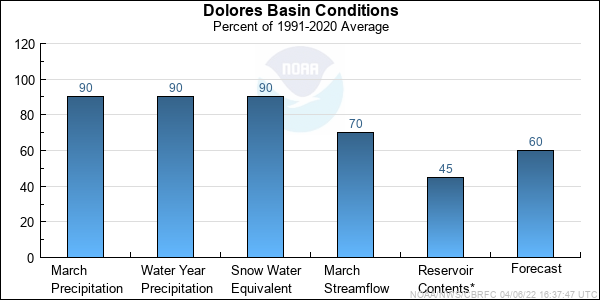
Dolores Basin Conditions


Snow Water Equivalent in Percent of Median.
* Percent usable capacity, not percent average contents.
Click for multi-month Graph.

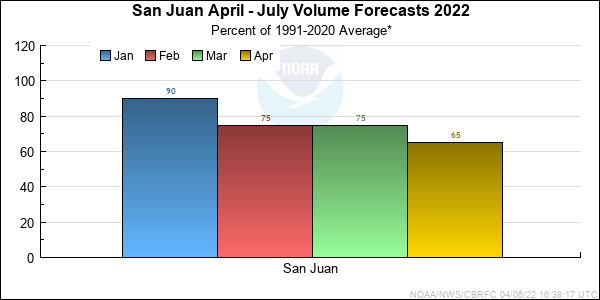
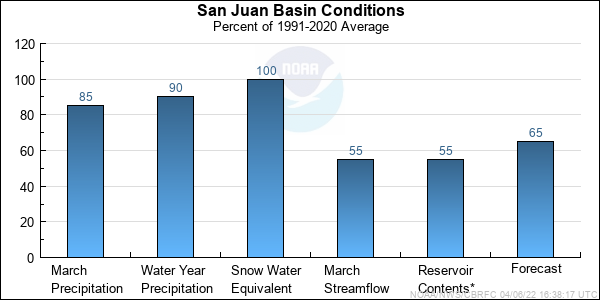
San Juan Basin Conditions


Snow Water Equivalent in Percent of Median.
* Percent usable capacity, not percent average contents.
Click for multi-month Graph.


Upper Green Specific Site Forecasts (kaf)

Click site name for graph.
Forecast
Period
90%
Exceedance
Volume
70%
Exceedance
Volume
50%
Exceedance
Volume
Percent
Average
30%
Exceedance
Volume
10%
Exceedance
Volume
Green
Daniel, Nr, Warren Bridge, At April-July140 160 180 71 200 225
Pine Ck
Fremont Lk, Abv April-July47 55 66 65 76 86
New Fork
Big Piney, Nr April-July105 140 175 49 220 285
Green
Fontenelle Reservoir, Fontenelle, Nr April-July260 335 435 59 510 585
Big Sandy
Farson, Nr April-July16 22 27 54 34 45
Green
Green River, Wy, Nr April-July260 320 425 58 525 615
Hams Fork
Frontier, Nr, Pole Ck, Blo April-July17 20 24 46 30 38
Viva Naughton Reservoir April-July20 23 28 38 36 48
Blacks Fork
Robertson, Nr April-July50 56 64 73 75 93
Ef Smiths Fork
Stateline Reservoir, Robertson,nr April-July15 17 20 71 23 27
Green
Flaming Gorge Reservoir April-July360 400 520 54 680 860


Yampa/White Specific Site Forecasts (kaf)

Click site name for graph.
Forecast
Period
90%
Exceedance
Volume
70%
Exceedance
Volume
50%
Exceedance
Volume
Percent
Average
30%
Exceedance
Volume
10%
Exceedance
Volume
Yampa
Stagecoach Rsvr, Abv April-July19 21 23 85 25 28
Steamboat Springs April-July140 165 185 71 210 245
Elk
Milner, Nr April-July230 265 285 86 330 365
Elkhead Ck
Long Gulch, Abv, Hayden, Nr April-July40 50 55 77 64 77
Yampa
Maybell, Nr April-July530 625 680 74 805 905
Little Snake
Slater, Nr April-July88 105 115 74 130 170
Dixon, Nr April-July155 190 215 65 260 345
Lily, Nr April-July160 195 220 68 275 370
Yampa
Deerlodge Park April-July700 825 920 77 1100 1270
White
Meeker, Nr April-July155 180 195 75 230 275
Watson, Nr April-July150 175 190 70 230 280


Duchesne Specific Site Forecasts (kaf)

Click site name for graph.
Forecast
Period
90%
Exceedance
Volume
70%
Exceedance
Volume
50%
Exceedance
Volume
Percent
Average
30%
Exceedance
Volume
10%
Exceedance
Volume
Big Brush Ck
Vernal, Nr, Red Fleet Res, Abv April-July9.5 11 14 71 16.7 21
Ashley Ck
Vernal, Nr April-July20 23 30 65 38 51
West Fork Duchesne
Vat Diversion, Blo April-July9.5 11 12.5 74 14.5 17.5
Duchesne
Tabiona, Nr April-July65 70 75 73 85 103
Rock Ck
Upper Stillwater Reservoir April-July48 52 60 83 70 85
South Fork Rock Ck
Docs Div, Blo April-July4 4.5 5.5 75 6.5 8
Rock Ck
Mountain Home, Nr April-July58 63 72 83 85 102
Currant Ck
Currant Ck Reservoir April-July9 11 14 79 17 23
Strawberry
Strawberry Reservoir, Soldier Springs April-July18 23 30 50 35 51
Starvation Reservoir, Duchesne, Nr April-July28 35 45 48 75 100
Duchesne
Duchesne, Nr, Knight Div, Abv April-July120 130 145 77 170 205
Lake Fork
Moon Lake Reservoir, Mtn Home, Nr April-July36 41 50 78 58 70
Yellowstone
Altonah, Nr April-July37 42 50 83 58 71
Whiterocks
Whiterocks, Nr April-July30 35 40 78 53 65
Uinta
Neola, Nr April-July40 47 58 81 71 90
Duchesne
Myton April-July140 165 195 64 260 350
Randlett, Nr April-July150 170 205 59 275 385


Lower Green Specific Site Forecasts (kaf)

Click site name for graph.
Forecast
Period
90%
Exceedance
Volume
70%
Exceedance
Volume
50%
Exceedance
Volume
Percent
Average
30%
Exceedance
Volume
10%
Exceedance
Volume
White
Blo Tabbyune Ck, Soldier Summit, Nr April-July5.5 7 8 63 9.5 14
Fish Ck
Scofield, Nr, Reservoir, Abv April-July17 19 21 81 25 34
Price
Scofield Reservoir, Scofield, Nr April-July21 24 27 79 31 45
Green
Green River, Ut April-July1380 1560 1800 64 2300 2900
Huntington Ck
Electric Lake April-July6.5 8 9 80 11 14
Power Plant, Blo April-July28 30 33 83 40 50
Seeley Ck
Joes Vly Reservoir, Orangeville, Nr April-July31 33 36 71 42 51
Ferron Ck
Ferron, Nr April-July18 21 24 69 27 35
Muddy Ck
Emery, Nr April-July9 10 11 60 12.5 15.5


Upper Colorado Mainstem Specific Site Forecasts (kaf)

Click site name for graph.
Forecast
Period
90%
Exceedance
Volume
70%
Exceedance
Volume
50%
Exceedance
Volume
Percent
Average
30%
Exceedance
Volume
10%
Exceedance
Volume
Colorado
Lake Granby, Granby, Nr April-July160 180 195 87 220 250
Willow Ck
Willow Ck Reservoir, Granby, Nr April-July33 40 48 96 55 65
Fraser
Winter Park April-July13 15 16.5 89 18 20
Williams Fork
Williams Fork Reservoir, Parshall April-July54 65 75 78 80 86
Muddy Ck
Wolford Mountain Reservoir April-July20 25 30 58 38 48
Blue
Dillon Reservoir April-July105 120 135 81 150 175
Green Mtn Reservoir April-July175 205 230 82 255 285
Colorado
Kremmling, Nr April-July550 650 730 84 800 900
Eagle
Gypsum, Blo April-July205 240 275 82 305 345
Colorado
Dotsero, Nr April-July900 1030 1150 82 1270 1400
Frying Pan
Ruedi Reservoir, Basalt, Nr April-July90 110 125 93 135 150
Roaring Fork
Glenwood Springs April-July480 540 590 90 650 740
Colorado
Glenwood Springs, Blo April-July1400 1620 1780 86 1950 2200
Cameo, Nr April-July1550 1780 1940 85 2150 2450
Cisco, Nr April-July2700 3050 3350 82 3750 4500
Lake Powell, Glen Cyn Dam, At April-July3100 3600 4100 64 4900 6500


Gunnison Specific Site Forecasts (kaf)

Click site name for graph.
Forecast
Period
90%
Exceedance
Volume
70%
Exceedance
Volume
50%
Exceedance
Volume
Percent
Average
30%
Exceedance
Volume
10%
Exceedance
Volume
Taylor
Taylor Park Reservoir April-July79 89 96 102 103 120
Almont April-July120 134 145 99 154 177
East
Almont April-July140 160 176 99 189 220
Gunnison
Gunnison, Nr April-July270 305 330 94 360 425
Tomichi Ck
Gunnison April-July32 41 47 70 56 70
Lake Fork
Gateview April-July72 80 89 75 103 130
Gunnison
Blue Mesa Reservoir April-July440 490 530 83 600 745
Morrow Point Reservoir April-July470 525 565 82 635 800
Crystal Reservoir April-July510 575 625 81 700 890
Muddy Ck
Paonia Reservoir, Bardine, Nr April-July52 63 75 93 85 96
Nf Gunnison
Somerset, Nr April-July185 210 235 89 255 290
Surface Ck
Cedaredge April-July10.5 12.9 14.8 101 16.9 20
Uncompahgre
Ridgway Reservoir April-July55 65 72 78 79 98
Colona April-July63 77 85 71 95 131
Delta April-July27 45 58 61 70 105
Gunnison
Grand Junction, Nr April-July875 1000 1100 83 1220 1520


Dolores Specific Site Forecasts (kaf)

Click site name for graph.
Forecast
Period
90%
Exceedance
Volume
70%
Exceedance
Volume
50%
Exceedance
Volume
Percent
Average
30%
Exceedance
Volume
10%
Exceedance
Volume
Dolores
Dolores April-July96 118 138 64 167 200
Mcphee Reservoir April-July106 128 152 60 188 230
San Miguel
Placerville, Nr April-July53 63 73 63 83 108
Dolores
Cisco, Nr April-July165 200 240 48 280 350


San Juan Specific Site Forecasts (kaf)

Click site name for graph.
Forecast
Period
90%
Exceedance
Volume
70%
Exceedance
Volume
50%
Exceedance
Volume
Percent
Average
30%
Exceedance
Volume
10%
Exceedance
Volume
San Juan
Pagosa Springs April-July115 129 140 72 160 194
Carracas, Nr April-July191 210 230 70 265 325
Navajo Reservoir, Archuleta, Nr April-July315 350 390 62 475 590
Bluff, Nr April-July530 590 670 60 780 885
Rio Blanco
Pagosa Springs, Nr, Blanco Dam, Blo April-July30 33 36 73 41 50
Navajo
Chromo, Nr, Oso Div Dam, Blo April-July35 38 42 72 47 60
Little Navajo
Oso Div Dam,bl,chromo,nr April-July2.5 3 3.4 56 4 5.2
Piedra
Arboles, Nr April-July90 101 109 60 130 159
Los Pinos
Vallecito Reservoir, Bayfield, Nr April-July109 120 128 72 150 173
Animas
Durango April-July230 255 275 71 325 395
Florida
Lemon Reservoir, Durango, Nr April-July25 29 32 67 38 49
La Plata
Hesperus April-July11.5 12.7 14 61 17.4 22
Mancos
Mancos, Nr April-July7.2 9.2 11 64 13.9 18

Differences between the full period forecasts and the residual forecasts may not exactly equal the actual observed volumes due to rounding conventions (see Definitions section).

Green End of Month Reservoir Contents (kaf)

EOM
Contents
Percent
EOM
Average
Percent
Usable
Capacity
Last Year
EOM
Last Year
%Average
EOM
Average
Usable
Capacity
untitled Green
Fontenelle Reservoir, Fontenelle, Nr 151.4 117 45 120.9 94 129.2 334.0
untitled Big Sandy
Big Sandy Reservoir, Nr Farson 8.4 43 22 9.2 47 19.7 38.3
Blacks Fork
Meeks Cabin 12.7 94 42 6.0 44 13.6 29.9
untitled Ef Smiths Fork
Stateline Reservoir, Robertson,nr 6.0 106 43 4.0 71 5.6 13.9
untitled Green
Flaming Gorge Reservoir 2932.9 95 78 3168.0 103 3079.2 3749.0
untitled Strawberry
Strawberry Reservoir, Soldier Springs 841.2 103 76 928.5 114 816.9 1105.9
Starvation Reservoir, Duchesne, Nr 150.8 99 91 161.3 106 151.7 165.3
untitled Rock Ck
Upper Stillwater Reservoir 3.4 70 11 2.0 42 4.8 31.4
untitled Lake Fork
Moon Lake Reservoir, Mtn Home, Nr 27.3 120 75 14.2 62 22.8 36.5
untitled Big Brush Ck
Red Fleet Reservoir, Vernal, Nr 11.5 62 45 16.6 89 18.7 25.7
untitled Price
Scofield Reservoir, Scofield, Nr 21.0 76 32 36.1 130 27.7 65.8
untitled Seeley Ck
Joes Vly Reservoir, Orangeville, Nr 22.9 59 37 38.5 99 38.8 62.5
untitled Huntington Ck
Electric Lake 10.4 61 33 18.6 109 17.0 31.5
untitled
TOTAL 4199.9 97 74 4523.8 104 4345.5 5689.6


Upper Colorado End of Month Reservoir Contents (kaf)

EOM
Contents
Percent
EOM
Average
Percent
Usable
Capacity
Last Year
EOM
Last Year
%Average
EOM
Average
Usable
Capacity
untitled Colorado
Lake Granby, Granby, Nr 301.8 92 62 355.3 108 327.9 490.3
untitled Willow Ck
Willow Ck Reservoir, Granby, Nr 9.1 108 100 7.0 83 8.4 9.1
untitled Williams Fork
Williams Fork Reservoir, Parshall 59.1 89 61 64.7 98 66.2 96.9
untitled Muddy Ck
Wolford Mountain Reservoir 30.2 68 46 52.8 118 44.7 66.0
untitled Blue
Dillon Reservoir 196.3 91 77 199.3 92 216.3 254.0
Green Mtn Reservoir 53.9 82 37 66.8 101 66.0 146.9
untitled Homestake Ck
Homestake Reservoir 14.4 57 34 11.8 46 25.4 43.0
untitled Frying Pan
Ruedi Reservoir, Basalt, Nr 55.2 87 54 58.4 92 63.7 102.0
untitled Plateau Ck
Vega Reservoir, Collbran, Nr 6.3 44 19 6.1 43 14.2 32.9
untitled Taylor
Taylor Park Reservoir 57.3 86 54 62.1 93 66.4 106.2
untitled Gunnison
Blue Mesa Reservoir 239.1 49 29 399.0 82 488.3 827.9
Morrow Point Reservoir 109.0 99 93 104.5 95 109.7 117.0
Crystal Reservoir 16.8 105 96 15.7 98 16.0 17.5
untitled Muddy Ck
Paonia Reservoir, Bardine, Nr 4.3 139 26 5.4 174 3.1 16.7
untitled Uncompahgre
Ridgway Reservoir 67.1 98 81 55.2 81 68.3 83.0
untitled Dolores
Mcphee Reservoir 177.1 66 46 169.4 63 269.9 381.1
untitled
TOTAL 1397.0 75 50 1633.3 88 1854.5 2790.6
Colorado
Lake Powell 5812.4 42 24 8843.8 63 13994.9 24322.0
untitled
TOTAL 5812.4 42 24 8843.8 63 13994.9 24322.0


San Juan End of Month Reservoir Contents (kaf)

EOM
Contents
Percent
EOM
Average
Percent
Usable
Capacity
Last Year
EOM
Last Year
%Average
EOM
Average
Usable
Capacity
untitled Los Pinos
Vallecito Reservoir, Bayfield, Nr 48.2 71 38 44.3 65 68.0 125.4
untitled San Juan
Navajo Reservoir, Archuleta, Nr 853.5 66 50 1042.2 80 1301.3 1696.0
untitled Florida
Lemon Reservoir, Durango, Nr 14.0 73 35 11.1 58 19.1 39.8
untitled
TOTAL 915.7 66 49 1097.6 79 1388.3 1861.2

Precipitation Maps


Definitions

10% exceedance forecast: Given the current hydrometeorological conditions, i.e current snowpack, soil moisture and streamflow, the volume that has a 10% chance of being exceeded. Previously referred to as "Reasonable Maximum Forecast".

50% exceedance forecast: Given the current hydrometeorological conditions, i.e current snowpack, soil moisture and streamflow, the volume that has a 50% chance of being exceeded. Previously referred to as "Most Probable Forecast".

90% exceedance forecast: Given the current hydrometeorological conditions, i.e current snowpack, soil moisture and streamflow, the volume that has a 90% chance of being exceeded. Previously referred to as "Reasonable Minimum Forecast".

Acre-Foot (af): The volume equal to one acre covered one foot deep (43,560 cubic feet). See kaf below.

Average: The arithmetic mean. The sum of the values divided by the number of values. Values from 1991-2020 are used for this publication.

Categories: Much Above Average=Greater than 130%, Above Average=111-130%, Near Average=90-110%, Below Average=70-89%, Much Below Average=Less than 70%.

CBRFC: Colorado Basin River Forecast Center.

Forecast Period: The period from April 1 through July 31, unless otherwise noted.

kaf: Thousand Acre-Feet. See Acre-Foot above.

Inflow: The volume of water that flows into a reservoir or lake.

Median: The middle value of an ordered set of values. Half of the values are higher and half of the values are lower. When the set contains an even number of values the median is the average of the two middle numbers.

NOAA: National Oceanic and Atomospheric Administration.

NWS: National Weather Service.

Rounding Conventions:
RangeRound to
0-1.990.01
2.0-19.90.1
20-1991.0
200-9995.0
1000+3 significant digits


Streamflow: The volume of water that flows past a specific stream site.

Water Year: The 12-month period, October 1 through September 30. The water year is designated by the calendar year in which it ends. Thus, the year ending September 30, 2008, is called the "2008 water year."


Additional Information

Water supply forecasts take into consideration present hydrometeorological conditions and use average basin temperatures and precipitation for the forecast period. As the forecast season progresses, a greater portion of the future hydrologic and climatic uncertainty becomes known and monthly forecasts become more accurate. For more information on the tools we use, consult Water Supply Forecasting Tools.

Volume forecasts represent adjusted flows; that is, observed flows with upstream water use taken into account. Adjusted flows will closely approximate natural or unimpaired flows. However, not all upstream diversions or impoundments are measured or quantifiable. For specific adjustments used with each forecast point, consult the Guide to Water Supply Forecasting.

The Water Supply Outlook is issued monthly January through May by the Colorado Basin River Forecast Center. It represents a coordinated effort between the National Weather Service, Natural Resources Conservation Service, Bureau of Reclamation, U.S. Geological Survey and local water district managers.

Note: Data used in this report are provisional and are subject to revision.

For more information, or to be included on the mailing list, please contact:

Colorado Basin River Forecast Center
2242 W North Temple
Salt Lake City, UT 84116
(801) 524-5130
www.cbrfc.noaa.gov