San Juan Water Supply Outlook, March 1, 2008

Note: This publication is scheduled for revision. If you have feedback on content, format, or publication frequency, please contact us.
Prepared by Cox
NOAA, National Weather Service
Colorado Basin River Forecast Center
Salt Lake City, Utah
www.cbrfc.noaa.gov

Contents

San Juan Summary

-Model Soil Moisture/Observed Streamflow...Soil moisture for all of the sub-basins in the San Juan are near normal for the upper portions. However, soil moisture conditions were much above average for the middle and lower portions of the sub-basins in the San Juan. Observed streamflow was below average for the headwaters of the San Juan, while the lower portions of the San Juan were above average.

-Snowpack/Precipitation...Snowpack above Navajo Reservoir remained high at 160 percent of average while the Animas and the entire San Juan Basin was 150 percent. Precipitation over the San Juan Basin was 155 percent of average with a seasonal average of 135 percent. The extreme was above Navajo Reservoir which received 170 percent of average for the month of February and a seasonal average of 155 percent.

-Short Term Precipitation Forecast...The forecast models through five days keep the San Juan Basin relatively dry with above average temperatures into the beginning of next week.

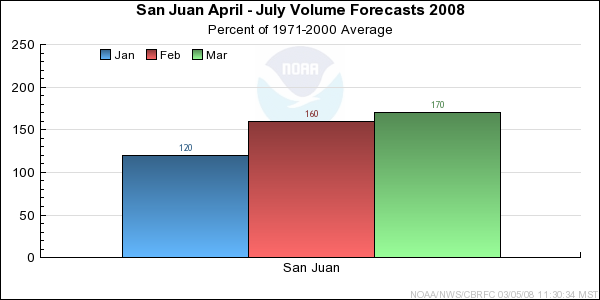
-General Discussion...The current snowpack along with both statistical forecast and ESP numbers suggest raising the forecast across some of the headwaters of the San Juan. The CPC guidance continues to show the possibility of increased chances of below normal precipitation for March through May across the San Juan Basin. However, CPC has been forecasting below average precipitation for the San Juan, and so far the dry forecast has not verified.


*Median of forecasts within each basin.


San Juan Basin Conditions


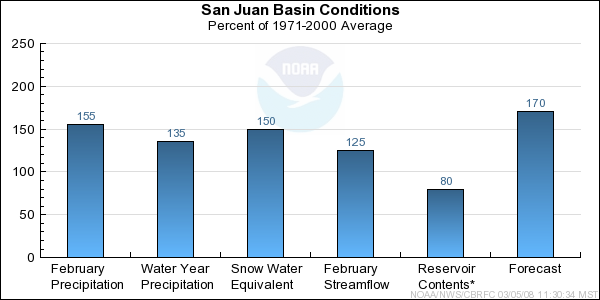
* Percent usable capacity, not percent average contents.
Click for multi-month Graph.


San Juan Specific Site Forecasts (kaf)

Click site name for graph.
Forecast
Period
90%
Exceedance
Volume
50%
Exceedance
Volume
Percent
Average
10%
Exceedance
Volume
San Juan
Pagosa Springs April-July265360160455
Carracas, Nr April-July490700173860
Navajo Res, Archuleta, Nr April-July98514001781800
Farmington April-July167021501782630
Bluff, Nr April-July164022001792760
Rio Blanco
Pagosa Springs, Nr, Blanco Dam, Blo April-July6790170118
Navajo
Chromo, Nr, Oso Div Dam, Blo April-July79110159140
Piedra
Arboles, Nr April-July260385167545
Los Pinos
Vallecito Res, Bayfield, Nr April-July230300146385
Animas
Durango April-July495680155825
Florida
Lemon Res, Durango, Nr April-July6685147103
La Plata
Hesperus April-July243514049
Mancos
Mancos, Nr April-July295215875
South Ck
Lloyd's Rsvr Nr Monticello, Abv March-July1.52.82144.7

Differences between the full period forecasts and the residual forecasts may not exactly equal the actual observed volumes due to rounding conventions (see Definitions section).

San Juan Reservoir Contents (kaf)

Usable
Capacity
EOM
Contents
Percent
Usable
Capacity
Last Year
EOM
Last Year
%Capacity
untitled Los Pinos
Vallecito Res, Bayfield, Nr 125.4 64.7 52 76.4 61
untitled San Juan
Navajo Res, Archuleta, Nr 1701.3 1381.1 81 1546.2 91
untitled Florida
Lemon Res, Durango, Nr 39.8 22.6 57 33.4 84
untitled
TOTAL 1866.5 1468.4 79 1656.1 89

Precipitation Maps


Definitions

10% exceedance forecast: Given the current hydrometeorological conditions, i.e current snowpack, soil moisture and streamflow, the volume that has a 10% chance of being exceeded. Previously referred to as "Reasonable Maximum Forecast".

50% exceedance forecast: Given the current hydrometeorological conditions, i.e current snowpack, soil moisture and streamflow, the volume that has a 50% chance of being exceeded. Previously referred to as "Most Probable Forecast".

90% exceedance forecast: Given the current hydrometeorological conditions, i.e current snowpack, soil moisture and streamflow, the volume that has a 90% chance of being exceeded. Previously referred to as "Reasonable Minimum Forecast".

Acre-Foot (af): The volume equal to one acre covered one foot deep (43,560 cubic feet). See kaf below.

Average: The arithmetic mean. The sum of the values divided by the number of values. Values from 1971-2000 are used for this publication.

Categories: Much Above Average=Greater than 130%, Above Average=111-130%, Near Average=90-110%, Below Average=70-89%, Much Below Average=Less than 70%.

CBRFC: Colorado Basin River Forecast Center.

Forecast Period: The period from April 1 through July 31, unless otherwise noted.

kaf: Thousand Acre-Feet. See Acre-Foot above.

Inflow: The volume of water that flows into a reservoir or lake.

Median: The middle value of an ordered set of values. Half of the values are higher and half of the values are lower. When the set contains an even number of values the median is the average of the two middle numbers.

NOAA: National Oceanic and Atomospheric Administration.

NWS: National Weather Service.

Rounding Conventions:
RangeRound to
0-1.990.01
2.0-19.90.1
20-1991.0
200-9995.0
1000+3 significant digits


Streamflow: The volume of water that flows past a specific stream site.

Water Year: The 12-month period, October 1 through September 30. The water year is designated by the calendar year in which it ends. Thus, the year ending September 30, 2008, is called the "2008 water year."


Additional Information

Water supply forecasts take into consideration present hydrometeorological conditions and use average basin temperatures and precipitation for the forecast period. As the forecast season progresses, a greater portion of the future hydrologic and climatic uncertainty becomes known and monthly forecasts become more accurate. For more information on the tools we use, consult Water Supply Forecasting Tools.

Volume forecasts represent adjusted flows; that is, observed flows with upstream water use taken into account. Adjusted flows will closely approximate natural or unimpaired flows. However, not all upstream diversions or impoundments are measured or quantifiable. For specific adjustments used with each forecast point, consult the Guide to Water Supply Forecasting.

The Water Supply Outlook is issued monthly January through May by the Colorado Basin River Forecast Center. It represents a coordinated effort between the National Weather Service, Natural Resources Conservation Service, Bureau of Reclamation, U.S. Geological Survey and local water district managers.

Note: Data used in this report are provisional and are subject to revision.

For more information, or to be included on the mailing list, please contact:

Colorado Basin River Forecast Center
2242 W North Temple
Salt Lake City, UT 84116
(801) 524-5130
www.cbrfc.noaa.gov


Hydrologist: Cox