
NOAA, National Weather Service
Colorado Basin River Forecast Center
Salt Lake City, Utah
www.cbrfc.noaa.gov
| Prepared by Cox NOAA, National Weather Service Colorado Basin River Forecast Center Salt Lake City, Utah www.cbrfc.noaa.gov |
| Forecast Period | 90% Exceedance Volume | 50% Exceedance Volume | Percent Average | 10% Exceedance Volume | |
| San Juan | |||||
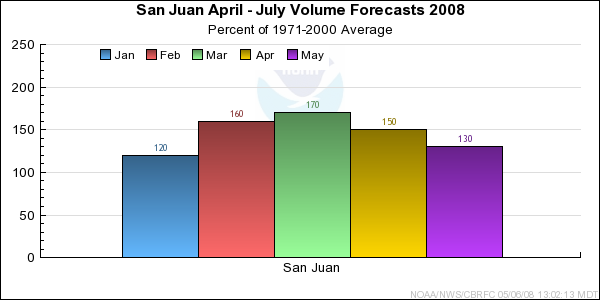
| Pagosa Springs | April-July | 245 | 290 | 129 | 335 |
| May-July | 195 | 240 | 125 | 285 | |
| Carracas, Nr | April-July | 460 | 540 | 133 | 630 |
| May-July | 350 | 430 | 132 | 520 | |
| Navajo Res, Archuleta, Nr | April-July | 845 | 1030 | 131 | 1240 |
| May-July | 605 | 785 | 128 | 1000 | |
| Farmington | April-July | 1380 | 1600 | 132 | 1820 |
| May-July | 1050 | 1270 | 129 | 1490 | |
| Bluff, Nr | April-July | 1250 | 1580 | 128 | 1910 |
| May-July | 940 | 1270 | 130 | 1600 | |
| Rio Blanco | |||||
| Pagosa Springs, Nr, Blanco Dam, Blo | April-July | 60 | 73 | 138 | 89 |
| May-July | 50 | 63 | 140 | 79 | |
| Navajo | |||||
| Chromo, Nr, Oso Div Dam, Blo | April-July | 74 | 90 | 130 | 109 |
| May-July | 59 | 75 | 129 | 94 | |
| Piedra | |||||
| Arboles, Nr | April-July | 255 | 305 | 133 | 360 |
| May-July | 163 | 210 | 122 | 265 | |
| Los Pinos | |||||
| Vallecito Res, Bayfield, Nr | April-July | 205 | 240 | 117 | 280 |
| May-July | 170 | 205 | 111 | 245 | |
| Animas | |||||
| Durango | April-July | 420 | 515 | 117 | 625 |
| May-July | 355 | 450 | 115 | 560 | |
| Florida | |||||
| Lemon Res, Durango, Nr | April-July | 53 | 64 | 110 | 77 |
| May-July | 45 | 56 | 106 | 69 | |
| La Plata | |||||
| Hesperus | April-July | 22 | 26 | 104 | 32 |
| May-July | 16.2 | 21 | 100 | 27 | |
| Mancos | |||||
| Mancos, Nr | April-July | 26 | 40 | 121 | 54 |
| May-July | 21 | 35 | 121 | 49 | |
| South Ck | |||||
| Lloyd's Rsvr Nr Monticello, Abv | March-July | 1 | 1.9 | 145 | 3.2 |
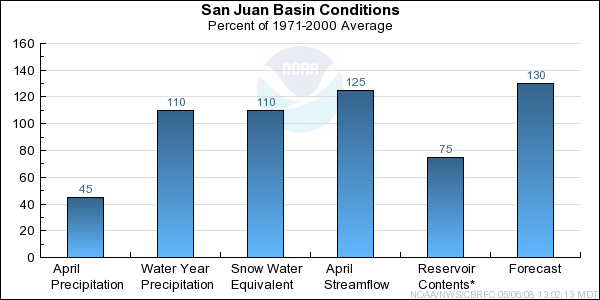
| Usable Capacity | EOM Contents | Percent Usable Capacity | Last Year EOM | Last Year %Capacity | |
|
| |||||
| Vallecito Res, Bayfield, Nr | 125.4 | 42.4 | 34 | 103.0 | 82 |
|
| |||||
| Navajo Res, Archuleta, Nr | 1701.3 | 1360.2 | 80 | 1622.0 | 95 |
|
| |||||
| Lemon Res, Durango, Nr | 39.8 | 21.3 | 54 | 36.0 | 90 |
|
| |||||
| TOTAL | 1866.5 | 1423.9 | 76 | 1760.9 | 94 |
| Range | Round to | |
| 0-1.99 | 0.01 | |
| 2.0-19.9 | 0.1 | |
| 20-199 | 1.0 | |
| 200-999 | 5.0 | |
| 1000+ | 3 significant digits |

