NOAA, National Weather Service
Colorado Basin River Forecast Center
Salt Lake City, Utah
www.cbrfc.noaa.gov
| Prepared by Patrick Kormos NOAA, National Weather Service Colorado Basin River Forecast Center Salt Lake City, Utah www.cbrfc.noaa.gov |
| Forecast Period | 90% Exceedance Volume | 70% Exceedance Volume | 50% Exceedance Volume | Percent Average | 30% Exceedance Volume | 10% Exceedance Volume | |
| Bear | |||||||
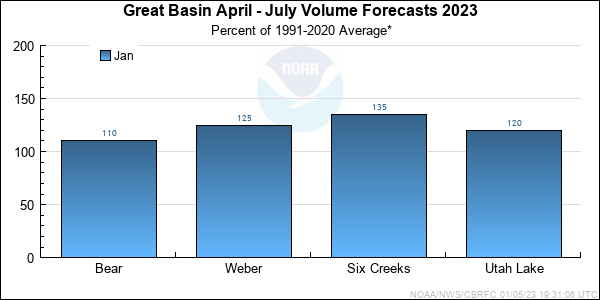
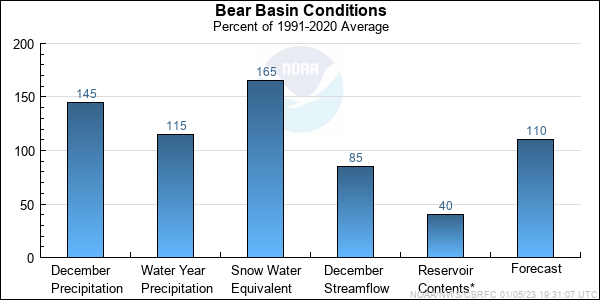
| Utah | April-July | 81 | 94 | 122 | 112 | 140 | 167 |
| Woodruff Narrows Rsvr, Abv | April-July | 67 | 83 | 121 | 112 | 150 | 205 |
| Stewart Dam * | April-July | 82 | 123 | 168 | 104 | 230 | 330 |
| Smiths Fork | |||||||
| Border, Nr | April-July | 58 | 74 | 94 | 107 | 104 | 125 |
| Logan | |||||||
| Logan, Nr, State Dam, Abv | April-July | 68 | 88 | 129 | 122 | 140 | 165 |
| Blacksmith Fork | |||||||
| Hyrum, Nr, Upnl Dam, Abv | April-July | 25 | 34 | 44 | 119 | 54 | 81 |
| Little Bear | |||||||
| Paradise | April-July | 24 | 35 | 47 | 121 | 65 | 91 |
| Forecast Period | 90% Exceedance Volume | 70% Exceedance Volume | 50% Exceedance Volume | Percent Average | 30% Exceedance Volume | 10% Exceedance Volume | |
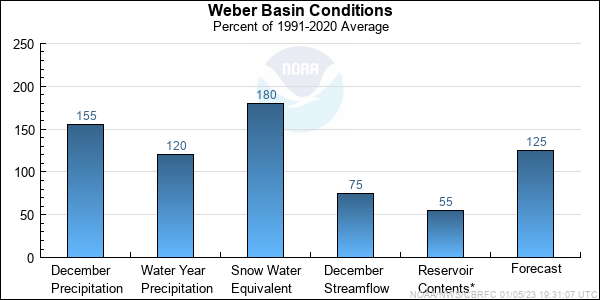
| Weber | |||||||
| Oakley, Nr | April-July | 81 | 93 | 133 | 120 | 145 | 182 |
| Rockport Res, Wanship, Nr | April-July | 75 | 96 | 148 | 129 | 166 | 215 |
| Coalville, Nr | April-July | 74 | 97 | 152 | 128 | 173 | 225 |
| Chalk Ck | |||||||
| Coalville | April-July | 18.9 | 28 | 45 | 129 | 62 | 75 |
| Weber | |||||||
| Echo Reservoir, Echo, At | April-July | 90 | 120 | 190 | 125 | 235 | 295 |
| Lost Ck | |||||||
| Lost Ck Reservoir, Croyden, Nr | April-July | 8.4 | 11.3 | 15.5 | 121 | 18.7 | 28 |
| East Canyon Ck | |||||||
| East Canyon Reservoir, Morgan, Nr | April-July | 17 | 27 | 33 | 143 | 45 | 58 |
| Weber | |||||||
| Gateway | April-July | 155 | 225 | 375 | 136 | 445 | 555 |
| Sf Ogden | |||||||
| Huntsville, Nr | April-July | 42 | 57 | 74 | 142 | 81 | 114 |
| Ogden | |||||||
| Pineview Reservoir, Ogden, Nr | April-July | 66 | 97 | 138 | 127 | 167 | 225 |
| Forecast Period | 90% Exceedance Volume | 70% Exceedance Volume | 50% Exceedance Volume | Percent Average | 30% Exceedance Volume | 10% Exceedance Volume | |
| Little Cottonwood Ck | |||||||
| Salt Lake City, Nr | April-July | 32 | 39 | 42 | 124 | 49 | 56 |
| Big Cottonwood Ck | |||||||
| Salt Lake City, Nr | April-July | 29 | 36 | 43 | 126 | 48 | 61 |
| Mill Ck | |||||||
| Salt Lake City, Nr | April-July | 4.4 | 5.9 | 7.4 | 142 | 8.4 | 10.2 |
| Dell Fk | |||||||
| Little Dell Reservoir | April-July | 3.4 | 4.9 | 6.7 | 152 | 8.5 | 9.5 |
| Lambs Ck | |||||||
| Salt Lake City, Nr | April-July | 4.3 | 5.5 | 7.5 | 174 | 9 | 11.1 |
| Parleys Ck | |||||||
| Salt Lake City, Nr | April-July | 9.3 | 13.4 | 18.9 | 164 | 24 | 27 |
| Red Butte Ck | |||||||
| Ft Douglas, At, Salt Lake City, Nr | April-July | 0.99 | 1.5 | 1.9 | 122 | 2.5 | 3 |
| City Ck | |||||||
| Salt Lake City, Nr | April-July | 5.1 | 5.9 | 7.4 | 114 | 9.2 | 10.2 |
| S Willow Ck | |||||||
| Grantsville, Nr | April-July | 1.5 | 1.8 | 2.1 | 70 | 2.8 | 3.4 |
| Forecast Period | 90% Exceedance Volume | 70% Exceedance Volume | 50% Exceedance Volume | Percent Average | 30% Exceedance Volume | 10% Exceedance Volume | |
| Spanish Fork | |||||||
| Castilla, Nr | April-July | 33 | 42 | 67 | 124 | 87 | 126 |
| Provo | |||||||
| Woodland, Nr | April-July | 79 | 98 | 116 | 121 | 142 | 166 |
| Hailstone, Nr | April-July | 93 | 114 | 134 | 126 | 164 | 195 |
| Deer Ck Reservoir | April-July | 106 | 131 | 165 | 139 | 215 | 250 |
| American Fork | |||||||
| American Fork, Nr, Up Pwrplnt, Abv | April-July | 20 | 27 | 32 | 128 | 40 | 51 |
| West Canyon Ck | |||||||
| Cedar Fort, Nr | April-July | 0.52 | 1.3 | 1.6 | 94 | 2.3 | 4.5 |
| Salt Ck | |||||||
| Nephi Powerplant Div, Blo | April-July | 4.4 | 7.4 | 11.1 | 142 | 14.6 | 21 |
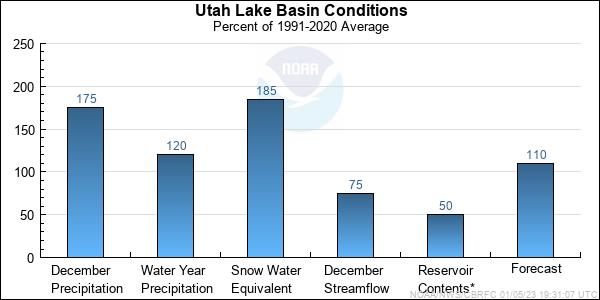
| Jordan | |||||||
| Utah Lake, Provo, Nr | April-July | 183 | 240 | 330 | 153 | 465 | 565 |
| Range | Round to | |
| 0-1.99 | 0.01 | |
| 2.0-19.9 | 0.1 | |
| 20-199 | 1.0 | |
| 200-999 | 5.0 | |
| 1000+ | 3 significant digits |