Great Basin Water Supply Outlook, February 1, 2008
Note: This publication is scheduled for revision. If you have feedback on content, format, or publication frequency, please contact us.
Contents
Great Basin Summary
The Northern Great Basin started the water year with average October precipitation, a dry and warm November,
a wet, cold and snowy December, followed by a wet and snowy January. January monthly precipitation was 143%
and seasonal precipitation totals are 109% of average. The indexed Great Basin snow is currently 119%
of average. Conditions in the Bear River Drainage are mostly average, except in the northeastern corner where
snows were still much below average on February 1.
Short term weather model guidance for northern Utah is predicting a moderately intense and fast hitting system with
storm total precipitation of approximately 1 inch ending February 8th. This storm will have little affect on the
overall forecast numbers, except possibly in the Bear River Basin. The 8-14 day model guidance suggest the probability
of a shift to above average temperatures. It also suggest a shift in probability to wet conditions in the northern most Bear
River Basin. All volumetric forecasts are currently in the average to above average category, except in the
northeastern Bear River where forecast are in the much below to below average category 60% to 89%. The remaining
forecasts ranged from 90% to 115% of average.
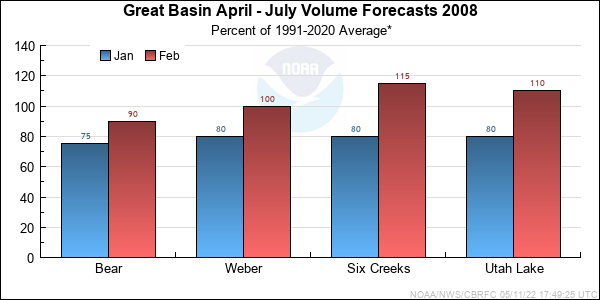
*Median of forecasts within each basin.
Bear Basin Conditions
Conditions in the Bear River Basin improved during January and now are generally in the range of average in terms
of snow and seasonal precipitation. Monthly precipitation was 138% of average and seasonal precipitation is now 97%
of average. Snow water equivalent improved from 80% of average to 97% of average on February 1, however on February
5th it increased to 104% of average. Currently, forecast range from 62% at Bear below Stewart Dam to 106% at Bear near
Utah-Wyoming State Line. Snow conditions in the northeast corner of the basin are still below average at 68% near the
Smith Fork Drainage.

* Percent usable capacity, not percent average contents.
Click for multi-month Graph.
Weber Basin Conditions
A wet January has greatly improved the outlook for the entire Weber River Basin as of February 1, 2008. Monthly precipitation
numbers were 150% of average and seasonal totals improved to 108% of average. Snow water equivalents improved from 83%
of average on January 1st to 119% of average on February 5th. April through July volume forecasts ranged from 101% to 116% of
average.
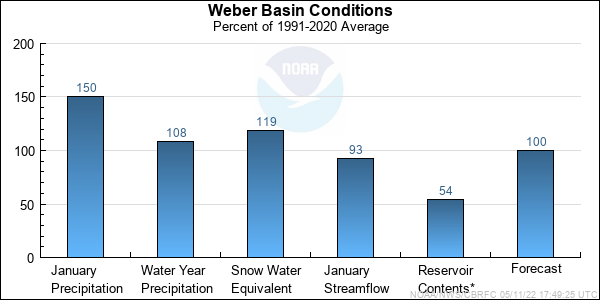
* Percent usable capacity, not percent average contents.
Click for multi-month Graph.
Six Creeks Basin Conditions
The Six Creeks basin continues to be the big winner in the northern Great Basin drainages in terms of snow and precipitation.
After a December with an impressive 183% of average monthly precipitation, January came in with 148% of average monthly
precipitation. Seasonal precipitation for the Six Creek area improved to 121% of average. The biggest increase was in snow
water equivalent which increased from 85% of average to 135% of average as of February 5th. The recording station at Alta
broke the 1949 precipitation record of 14.09 inches, with a new record 16.4 inches (275% of average) and 170 inches of snow.
The normal monthly precipitation is 5.99 inches and the normal monthly snow average is 93 inches. Forecasts for the basin range from
111% to 116% of average.
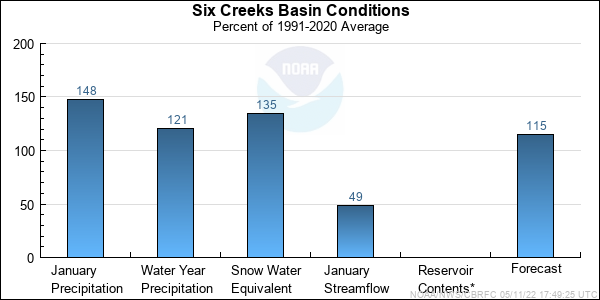
* Percent usable capacity, not percent average contents.
Click for multi-month Graph.
Utah Lake Basin Conditions
The Utah Lake Basin which includes the Provo river, Spanish Fork and American Fork drainages had a very cold and snowy January.
Monthly precipitation was recorded at 147% of average and seasonal numbers increased to 114% of average. Snow water
eqivalent conditions were the big winner improving from 83% of average on January 1st to 117% of average on February 5th.
April through July water supply forecast now range from 110% to 116% of average.
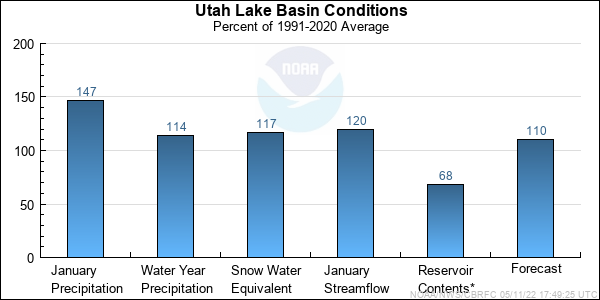
* Percent usable capacity, not percent average contents.
Click for multi-month Graph.
Differences between the full period forecasts and the residual forecasts may not exactly equal the actual observed volumes due to rounding conventions (see Definitions section).
Precipitation Maps


Hydrologist: Brent Bernard
