NOAA, National Weather Service
Colorado Basin River Forecast Center
Salt Lake City, Utah
www.cbrfc.noaa.gov
| Prepared by B.Bernard NOAA, National Weather Service Colorado Basin River Forecast Center Salt Lake City, Utah www.cbrfc.noaa.gov |


| Forecast Period | 90% Exceedance Volume | 70% Exceedance Volume | 50% Exceedance Volume | Percent Average | 30% Exceedance Volume | 10% Exceedance Volume | |
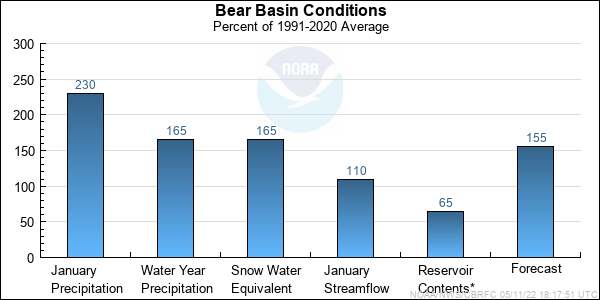
| Bear | |||||||
| Utah | April-July | 129 | 144 | 160 | 143 | 177 | 195 |
| Woodruff Narrows Rsvr, Abv | April-July | 121 | 156 | 177 | 146 | 215 | 275 |
| Montpelier, Nr, Stewart Dam, Blo * | April-July | 295 | 360 | 410 | 225 | 480 | 625 |
| Smiths Fork | |||||||
| Border, Nr | April-July | 108 | 121 | 134 | 151 | 142 | 173 |
| Logan | |||||||
| Logan, Nr, State Dam, Abv | April-July | 143 | 160 | 172 | 155 | 185 | 215 |
| Blacksmith Fork | |||||||
| Hyrum, Nr, Upnl Dam, Abv | April-July | 65 | 73 | 83 | 193 | 95 | 112 |
| Little Bear | |||||||
| Paradise | April-July | 68 | 77 | 89 | 189 | 107 | 122 |
| Forecast Period | 90% Exceedance Volume | 70% Exceedance Volume | 50% Exceedance Volume | Percent Average | 30% Exceedance Volume | 10% Exceedance Volume | |
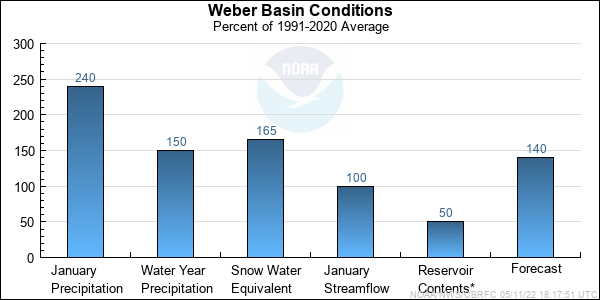
| Weber | |||||||
| Oakley, Nr | April-July | 116 | 135 | 152 | 129 | 170 | 194 |
| Rockport Res, Wanship, Nr | April-July | 128 | 155 | 175 | 133 | 194 | 235 |
| Coalville, Nr | April-July | 129 | 157 | 181 | 135 | 200 | 245 |
| Chalk Ck | |||||||
| Coalville | April-July | 39 | 50 | 60 | 146 | 72 | 88 |
| Weber | |||||||
| Echo Res, Echo, At | April-July | 168 | 210 | 230 | 135 | 275 | 325 |
| Lost Ck | |||||||
| Lost Ck Res, Croydon, Nr | April-July | 15.1 | 19.6 | 23 | 172 | 27 | 34 |
| East Canyon Ck | |||||||
| East Canyon Res, Morgan, Nr | April-July | 23 | 31 | 37 | 137 | 43 | 51 |
| Weber | |||||||
| Gateway | April-July | 360 | 440 | 500 | 154 | 600 | 680 |
| Sf Ogden | |||||||
| Huntsville, Nr | April-July | 77 | 90 | 98 | 175 | 113 | 137 |
| Ogden | |||||||
| Pineview Res, Ogden, Nr | April-July | 179 | 210 | 230 | 204 | 260 | 310 |
| Forecast Period | 90% Exceedance Volume | 70% Exceedance Volume | 50% Exceedance Volume | Percent Average | 30% Exceedance Volume | 10% Exceedance Volume | |
| Little Cottonwood Ck | |||||||
| Salt Lake City, Nr | April-July | 40 | 44 | 48 | 126 | 52 | 57 |
| Big Cottonwood Ck | |||||||
| Salt Lake City, Nr | April-July | 34 | 39 | 44 | 122 | 47 | 57 |
| Mill Ck | |||||||
| Salt Lake City, Nr | April-July | 4.7 | 5.7 | 6.6 | 103 | 7.5 | 8.7 |
| Dell Fk | |||||||
| Little Dell Res | April-July | 4.6 | 5.5 | 6.6 | 120 | 8.1 | 9 |
| Parleys Ck | |||||||
| Salt Lake City, Nr | April-July | 11.7 | 13.7 | 17.5 | 123 | 21 | 25 |
| Emigration Ck | |||||||
| Salt Lake City, Nr | April-July | 3.4 | 4.6 | 5.6 | 140 | 7.3 | 9.4 |
| City Ck | |||||||
| Salt Lake City, Nr | April-July | 5.8 | 7 | 7.9 | 103 | 9.5 | 11.1 |
| S Willow Ck | |||||||
| Grantsville, Nr | April-July | 2.5 | 3.1 | 3.5 | 113 | 4 | 4.9 |
| Forecast Period | 90% Exceedance Volume | 70% Exceedance Volume | 50% Exceedance Volume | Percent Average | 30% Exceedance Volume | 10% Exceedance Volume | |
| Spanish Fork | |||||||
| Castilla, Nr | April-July | 65 | 85 | 96 | 139 | 110 | 153 |
| Provo | |||||||
| Woodland, Nr | April-July | 117 | 138 | 148 | 148 | 164 | 186 |
| Hailstone, Nr | April-July | 134 | 152 | 164 | 149 | 188 | 210 |
| Deer Ck Res | April-July | 161 | 190 | 215 | 169 | 230 | 280 |
| American Fork | |||||||
| American Fork, Nr, Up Pwrplnt, Abv | April-July | 35 | 39 | 45 | 145 | 51 | 59 |
| West Canyon Ck | |||||||
| Cedar Fort, Nr | April-July | 1.2 | 1.7 | 2.1 | 119 | 2.5 | 4.9 |
| Jordan | |||||||
| Utah Lake, Provo, Nr | April-July | 375 | 450 | 520 | 160 | 580 | 700 |
| Range | Round to | |
| 0-1.99 | 0.01 | |
| 2.0-19.9 | 0.1 | |
| 20-199 | 1.0 | |
| 200-999 | 5.0 | |
| 1000+ | 3 significant digits |