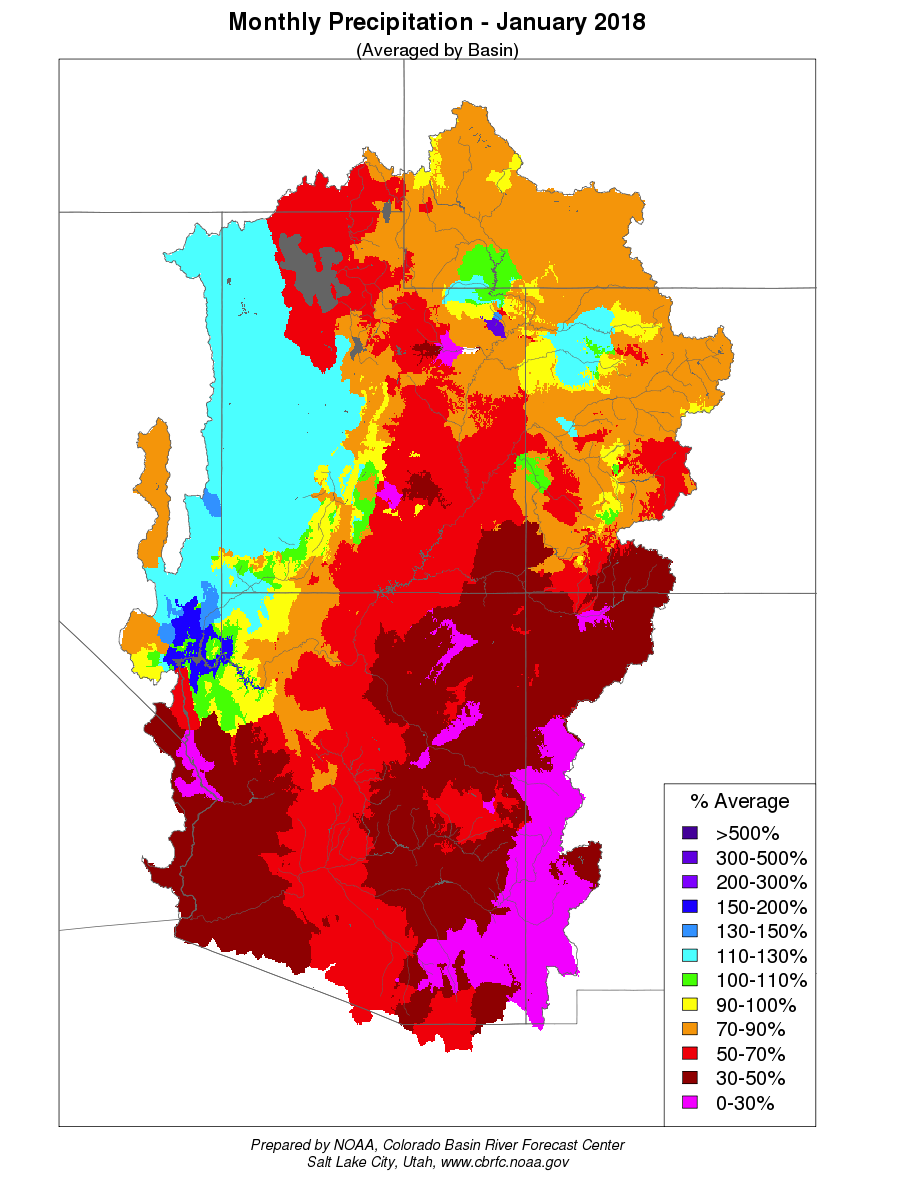
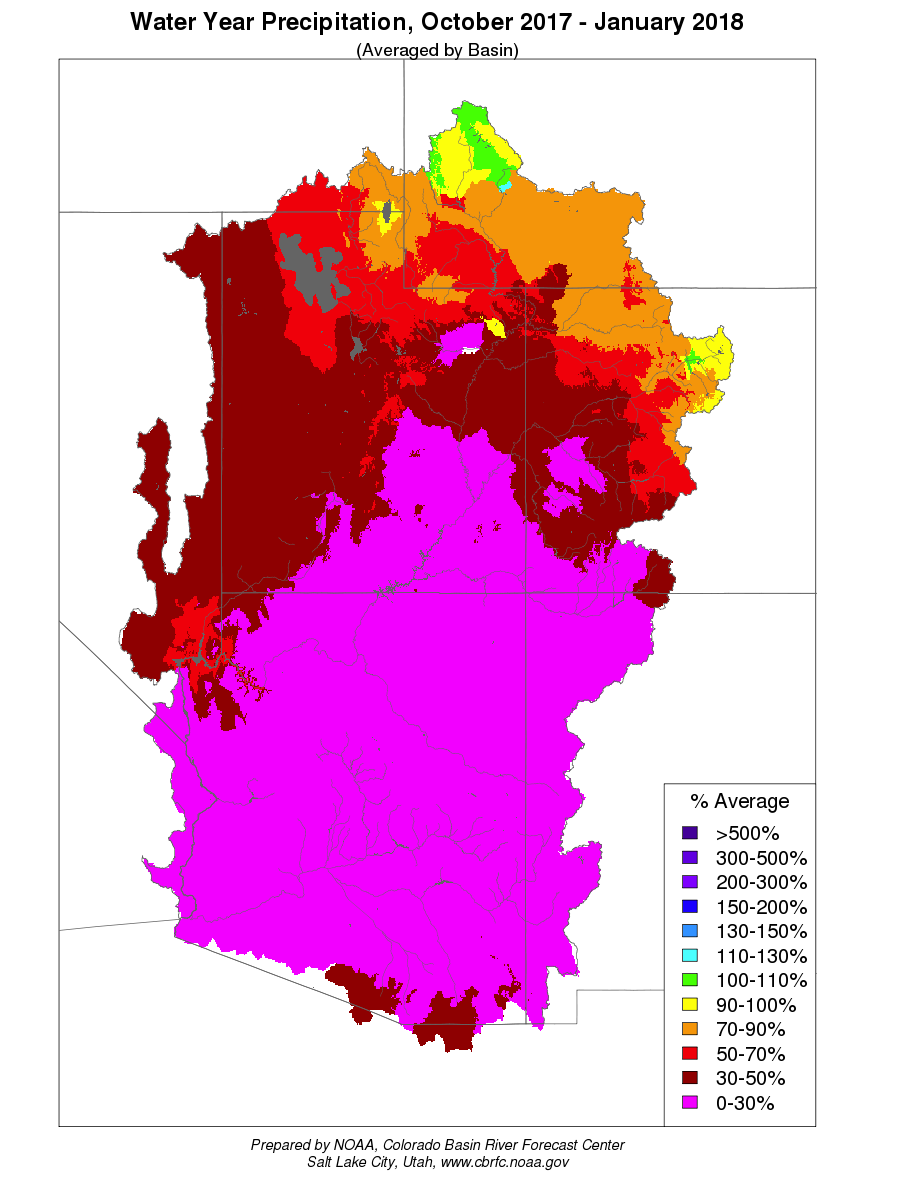
NOAA, National Weather Service
Colorado Basin River Forecast Center
Salt Lake City, Utah
www.cbrfc.noaa.gov
| Prepared by B.Bernard, Patrick Kormos NOAA, National Weather Service Colorado Basin River Forecast Center Salt Lake City, Utah www.cbrfc.noaa.gov |
| Forecast Period | 90% Exceedance Volume | 70% Exceedance Volume | 50% Exceedance Volume | Percent Average | 30% Exceedance Volume | 10% Exceedance Volume | |
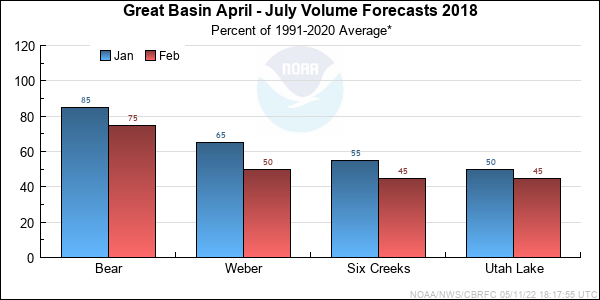
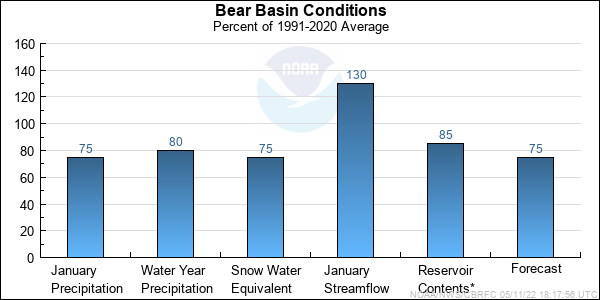
| Bear | |||||||
| Utah | April-July | 69 | 85 | 99 | 88 | 113 | 135 |
| Woodruff Narrows Rsvr, Abv | April-July | 55 | 72 | 86 | 71 | 107 | 146 |
| Montpelier, Nr, Stewart Dam, Blo * | April-July | 43 | 62 | 83 | 46 | 143 | 220 |
| Smiths Fork | |||||||
| Border, Nr | April-July | 40 | 57 | 73 | 82 | 86 | 104 |
| Logan | |||||||
| Logan, Nr, State Dam, Abv | April-July | 71 | 86 | 98 | 88 | 106 | 135 |
| Blacksmith Fork | |||||||
| Hyrum, Nr, Upnl Dam, Abv | April-July | 25 | 28 | 32 | 74 | 37 | 49 |
| Little Bear | |||||||
| Paradise | April-July | 10.3 | 15.6 | 21 | 45 | 30 | 42 |
| Forecast Period | 90% Exceedance Volume | 70% Exceedance Volume | 50% Exceedance Volume | Percent Average | 30% Exceedance Volume | 10% Exceedance Volume | |
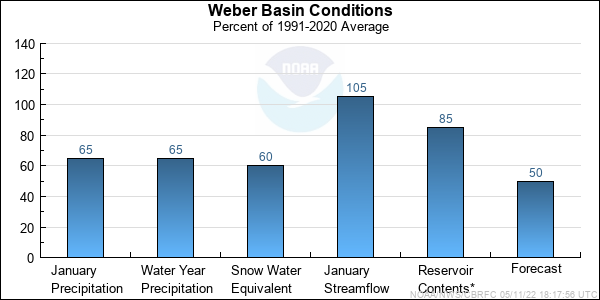
| Weber | |||||||
| Oakley, Nr | April-July | 49 | 60 | 76 | 64 | 90 | 112 |
| Rockport Res, Wanship, Nr | April-July | 40 | 54 | 67 | 51 | 88 | 117 |
| Coalville, Nr | April-July | 37 | 52 | 66 | 49 | 87 | 117 |
| Chalk Ck | |||||||
| Coalville | April-July | 10.4 | 14.3 | 18.1 | 44 | 26 | 38 |
| Weber | |||||||
| Echo Res, Echo, At | April-July | 46 | 65 | 85 | 50 | 111 | 154 |
| Lost Ck | |||||||
| Lost Ck Res, Croydon, Nr | April-July | 3.3 | 4.8 | 6.2 | 46 | 6.9 | 10.5 |
| East Canyon Ck | |||||||
| East Canyon Res, Morgan, Nr | April-July | 8.7 | 10.6 | 13.7 | 51 | 18 | 22 |
| Weber | |||||||
| Gateway | April-July | 79 | 104 | 142 | 44 | 183 | 275 |
| Sf Ogden | |||||||
| Huntsville, Nr | April-July | 21 | 29 | 34 | 61 | 45 | 64 |
| Ogden | |||||||
| Pineview Res, Ogden, Nr | April-July | 29 | 45 | 56 | 50 | 85 | 119 |
| Forecast Period | 90% Exceedance Volume | 70% Exceedance Volume | 50% Exceedance Volume | Percent Average | 30% Exceedance Volume | 10% Exceedance Volume | |
| Little Cottonwood Ck | |||||||
| Salt Lake City, Nr | April-July | 18.3 | 21 | 24 | 63 | 27 | 32 |
| Big Cottonwood Ck | |||||||
| Salt Lake City, Nr | April-July | 13.1 | 16.7 | 21 | 58 | 25 | 31 |
| Mill Ck | |||||||
| Salt Lake City, Nr | April-July | 2 | 2.5 | 3 | 47 | 3.7 | 4.9 |
| Dell Fk | |||||||
| Little Dell Res | April-July | 1.1 | 1.8 | 2.7 | 49 | 3.8 | 4.3 |
| Lambs Ck | |||||||
| Salt Lake City, Nr | April-July | 1.1 | 1.6 | 2.4 | 45 | 3 | 4.4 |
| Parleys Ck | |||||||
| Salt Lake City, Nr | April-July | 3 | 4.4 | 6.4 | 45 | 8.5 | 10.5 |
| Emigration Ck | |||||||
| Salt Lake City, Nr | April-July | 0.43 | 0.88 | 1.3 | 32 | 1.8 | 2.3 |
| Red Butte Ck | |||||||
| Ft Douglas, At, Salt Lake City, Nr | April-July | 0.37 | 0.45 | 0.57 | 30 | 0.78 | 1.2 |
| City Ck | |||||||
| Salt Lake City, Nr | April-July | 2.7 | 3.4 | 4.1 | 53 | 5.2 | 6.5 |
| S Willow Ck | |||||||
| Grantsville, Nr | April-July | 1.1 | 1.3 | 1.6 | 50 | 2 | 2.6 |
| Forecast Period | 90% Exceedance Volume | 70% Exceedance Volume | 50% Exceedance Volume | Percent Average | 30% Exceedance Volume | 10% Exceedance Volume | |
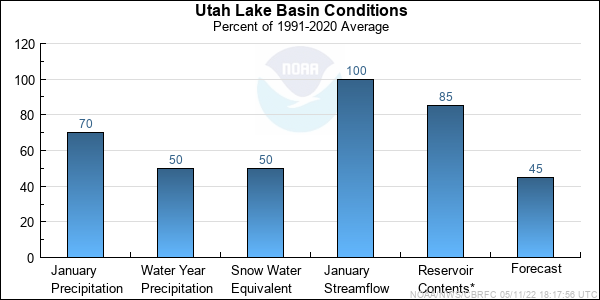
| Spanish Fork | |||||||
| Castilla, Nr | April-July | 16.2 | 20 | 24 | 35 | 29 | 38 |
| Provo | |||||||
| Woodland, Nr | April-July | 49 | 63 | 75 | 75 | 88 | 109 |
| Hailstone, Nr | April-July | 53 | 68 | 82 | 75 | 95 | 118 |
| Deer Ck Res | April-July | 53 | 69 | 85 | 67 | 101 | 130 |
| American Fork | |||||||
| American Fork, Nr, Up Pwrplnt, Abv | April-July | 7.2 | 9.8 | 12 | 39 | 15.1 | 19 |
| West Canyon Ck | |||||||
| Cedar Fort, Nr | April-July | 0.27 | 0.38 | 0.43 | 24 | 0.71 | 1.6 |
| Salt Ck | |||||||
| Nephi Powerplant Div, Blo | April-July | 1.3 | 2.5 | 3.2 | 39 | 4.2 | 7.4 |
| Jordan | |||||||
| Utah Lake, Provo, Nr | April-July | 97 | 125 | 172 | 53 | 198 | 250 |
| Range | Round to | |
| 0-1.99 | 0.01 | |
| 2.0-19.9 | 0.1 | |
| 20-199 | 1.0 | |
| 200-999 | 5.0 | |
| 1000+ | 3 significant digits |