NOAA, National Weather Service
Colorado Basin River Forecast Center
Salt Lake City, Utah
www.cbrfc.noaa.gov
| Prepared by Brent.Bernard, Patrick Kormos NOAA, National Weather Service Colorado Basin River Forecast Center Salt Lake City, Utah www.cbrfc.noaa.gov |
| Forecast Period | 90% Exceedance Volume | 70% Exceedance Volume | 50% Exceedance Volume | Percent Average | 30% Exceedance Volume | 10% Exceedance Volume | |
| Bear | |||||||
| Utah | April-July | 91 | 104 | 121 | 108 | 132 | 167 |
| Woodruff Narrows Rsvr, Abv | April-July | 74 | 94 | 112 | 93 | 130 | 199 |
| Montpelier, Nr, Stewart Dam, Blo * | April-July | 137 | 157 | 173 | 95 | 225 | 335 |
| Smiths Fork | |||||||
| Border, Nr | April-July | 68 | 76 | 87 | 98 | 99 | 122 |
| Logan | |||||||
| Logan, Nr, State Dam, Abv | April-July | 89 | 98 | 112 | 101 | 122 | 156 |
| Blacksmith Fork | |||||||
| Hyrum, Nr, Upnl Dam, Abv | April-July | 32 | 37 | 45 | 105 | 57 | 75 |
| Little Bear | |||||||
| Paradise | April-July | 23 | 28 | 40 | 85 | 51 | 70 |
| Forecast Period | 90% Exceedance Volume | 70% Exceedance Volume | 50% Exceedance Volume | Percent Average | 30% Exceedance Volume | 10% Exceedance Volume | |
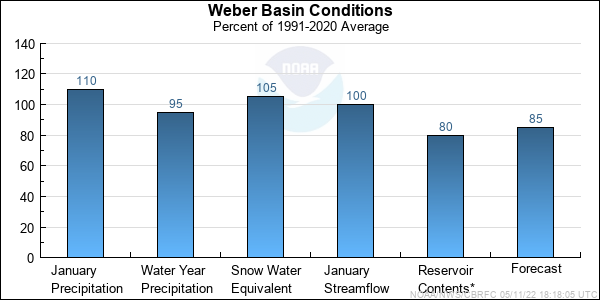
| Weber | |||||||
| Oakley, Nr | April-July | 79 | 91 | 108 | 92 | 125 | 160 |
| Rockport Res, Wanship, Nr | April-July | 77 | 92 | 113 | 86 | 132 | 183 |
| Coalville, Nr | April-July | 77 | 94 | 115 | 86 | 136 | 191 |
| Chalk Ck | |||||||
| Coalville | April-July | 15 | 20 | 32 | 78 | 38 | 57 |
| Weber | |||||||
| Echo Reservoir, Echo, At | April-July | 92 | 108 | 142 | 83 | 177 | 250 |
| Lost Ck | |||||||
| Lost Ck Reservoir, Croyden, Nr | April-July | 6.2 | 9 | 11 | 82 | 13 | 18.8 |
| East Canyon Ck | |||||||
| East Canyon Reservoir, Morgan, Nr | April-July | 18.2 | 24 | 29 | 107 | 38 | 44 |
| Weber | |||||||
| Gateway | April-July | 156 | 210 | 260 | 80 | 350 | 475 |
| Sf Ogden | |||||||
| Huntsville, Nr | April-July | 37 | 46 | 56 | 100 | 69 | 93 |
| Ogden | |||||||
| Pineview Reservoir, Ogden, Nr | April-July | 65 | 79 | 102 | 90 | 143 | 186 |
| Forecast Period | 90% Exceedance Volume | 70% Exceedance Volume | 50% Exceedance Volume | Percent Average | 30% Exceedance Volume | 10% Exceedance Volume | |
| Little Cottonwood Ck | |||||||
| Salt Lake City, Nr | April-July | 32 | 34 | 39 | 103 | 43 | 51 |
| Big Cottonwood Ck | |||||||
| Salt Lake City, Nr | April-July | 28 | 31 | 37 | 103 | 41 | 52 |
| Mill Ck | |||||||
| Salt Lake City, Nr | April-July | 4.3 | 5 | 6.1 | 95 | 7 | 8.5 |
| Dell Fk | |||||||
| Little Dell Reservoir | April-July | 3.6 | 4.6 | 5.6 | 102 | 7 | 8.4 |
| Lambs Ck | |||||||
| Salt Lake City, Nr | April-July | 3.4 | 4.1 | 5.4 | 102 | 6.6 | 8.6 |
| Parleys Ck | |||||||
| Salt Lake City, Nr | April-July | 8.8 | 10.5 | 13.9 | 98 | 18.1 | 22 |
| Red Butte Ck | |||||||
| Ft Douglas, At, Salt Lake City, Nr | April-July | 1 | 1.2 | 1.7 | 88 | 2.1 | 2.9 |
| City Ck | |||||||
| Salt Lake City, Nr | April-July | 5.2 | 6.1 | 6.8 | 88 | 8.2 | 10.1 |
| S Willow Ck | |||||||
| Grantsville, Nr | April-July | 2.2 | 2.5 | 2.7 | 87 | 3.4 | 4.2 |
| Forecast Period | 90% Exceedance Volume | 70% Exceedance Volume | 50% Exceedance Volume | Percent Average | 30% Exceedance Volume | 10% Exceedance Volume | |
| Spanish Fork | |||||||
| Castilla, Nr | April-July | 32 | 40 | 47 | 68 | 58 | 83 |
| Provo | |||||||
| Woodland, Nr | April-July | 75 | 84 | 100 | 100 | 117 | 148 |
| Hailstone, Nr | April-July | 80 | 92 | 109 | 99 | 126 | 162 |
| Deer Ck Reservoir | April-July | 86 | 100 | 126 | 99 | 142 | 190 |
| American Fork | |||||||
| American Fork, Nr, Up Pwrplnt, Abv | April-July | 16.4 | 19.6 | 23 | 74 | 29 | 37 |
| West Canyon Ck | |||||||
| Cedar Fort, Nr | April-July | 0.96 | 1.5 | 1.8 | 104 | 2.2 | 4.5 |
| Salt Ck | |||||||
| Nephi Powerplant Div, Blo | April-July | 3.8 | 5.5 | 7.2 | 87 | 9.1 | 18.7 |
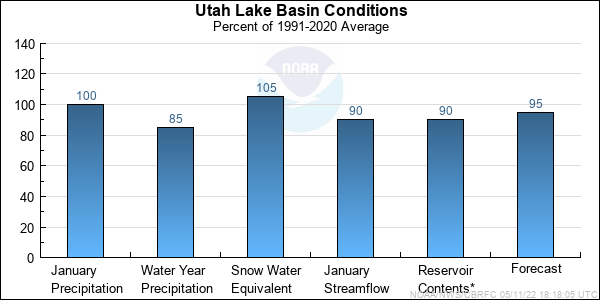
| Jordan | |||||||
| Utah Lake, Provo, Nr | April-July | 179 | 205 | 270 | 83 | 310 | 435 |
| Range | Round to | |
| 0-1.99 | 0.01 | |
| 2.0-19.9 | 0.1 | |
| 20-199 | 1.0 | |
| 200-999 | 5.0 | |
| 1000+ | 3 significant digits |